
Figure 5. Overview of substrate utilization patterns in stromatolitic mats using phenotypic microarrays.
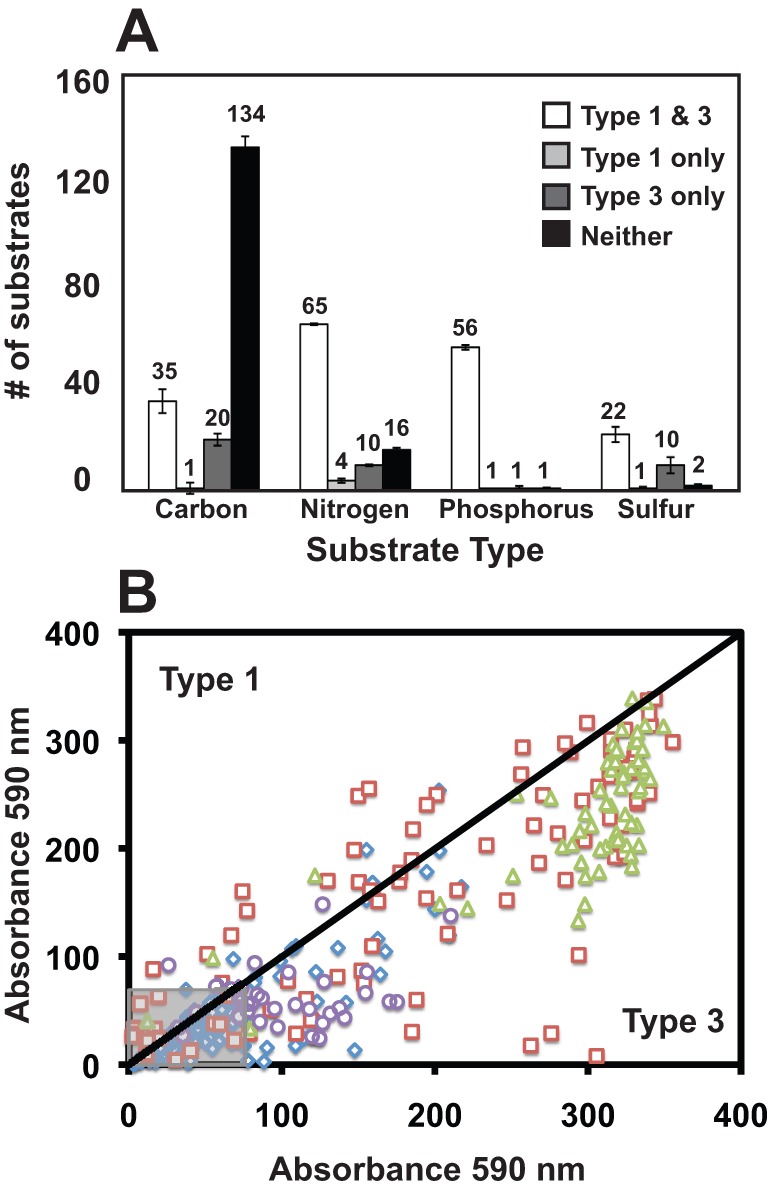
A. The specific number of carbon, nitrogen, phosphorus and sulfur substrates used by the Type 1 and 3 communities are listed at the top of each column. Error bars reflect standard error of the mean between three independent replicates of the microarray assays using microbial mat slurries. B. Comparison of absorbance readings between Type 1 and 3 mats indicating higher utilization of most carbon (blue diamonds), nitrogen (red squares), phosphorus (green triangles) and sulfur (purple circles) substrates by lithifying Type 3 mats. Grey box represents those substrates below threshold absorbance levels.