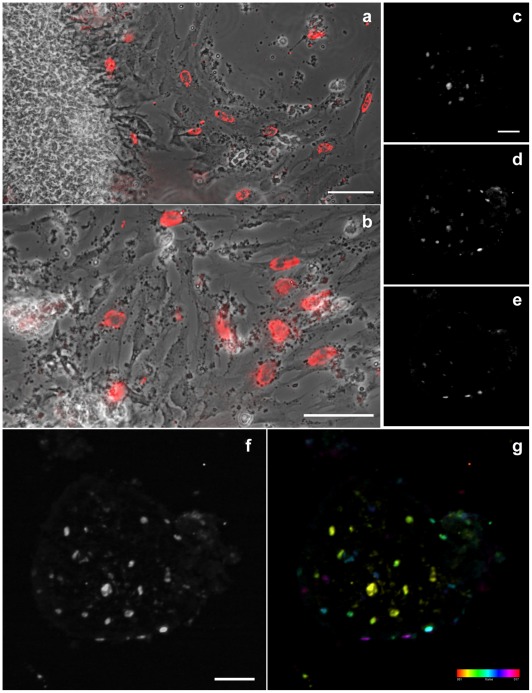
Figure 6. Proliferation rate of 2D and 3D-cardiac cells.
24-hs cardiac cell cultures were incubated with BrdU (3 ug/mL) and stained with anti-BrdU antibody. 2D-isolated cells were analyzed by phase contrast (a–b, gray) and conventional fluorescence microscopy (a–b, red), while 3D-aggregates were analyzed by confocal microscopy (c–g). Images (a, b) are different magnifications. BrdU-positive nuclei are found in both 2D and 3D-cells, but are more frequent in 2D-cells (a–g). Selected confocal slices, 10 µm apart, from bottom to top are shown in images (c–e). Note the difference in the distribution of BrdU positive cells along the aggregate Z-axis (c–e). All focal planes were merged in image (f), where it is possible to see the whole aggregate because of the faint fluorescence background. The relative position of all cells can be better visualized in the depth-color coded image shown in (g). The colored scale represents slice count, from bottom to top, each 2 µm apart. Scale bars in images (a, b, c, f) correspond to 50 µm.

