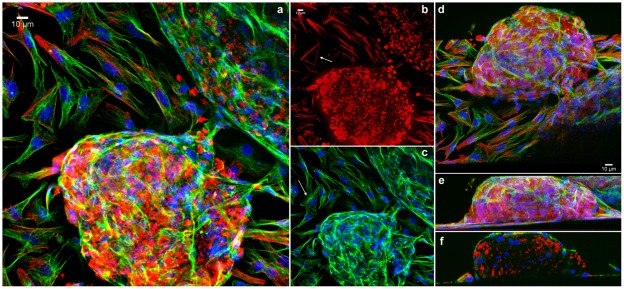
Figure 8. Analysis of the distribution of the cytoskeleton in 2D- and 3D-cardiac cultures.
Cells were grown for 48 hours, fixed with 4% paraformaldehyde and triple-stained with Texas red-phalloidin (red), mouse monoclonal anti-α-tubulin antibody (green), and the DNA-specific probe DAPI (blue). Cells were analyzed in a Leica laser scanning confocal microscope. Different optical focal planes of the cells were acquired and projected in order to show both the 2D-cells and the 3D-aggregates (a). The same stack in a can be seen with the F-actin stain only, where 2D-cells display well organized stress fibers (arrow, b) whereas no detectable stress fibers are seen in the 3D-aggregates (b). Again, in the same stack in (a, b), microtubules and nuclei were superposed to show well spread microtubules in 2D-cells (arrow), whereas only a few cells in the surface of the aggregates display organized microtubules (a, c). Note MTOCs close to the nuclei in 2D-cells. The same stack can be seen in a tilted projection in (d), showing the relationship of 2D and 3D cells. The same stack can be seen in a lateral view, showing the volume of the aggregate and the connection between 2D and 3D-cells (e). Lastly, the same stack is shown in a transverse section of a lateral projection, showing the distribution of microtubules, microfilaments and nuclei inside the aggregate (f).

