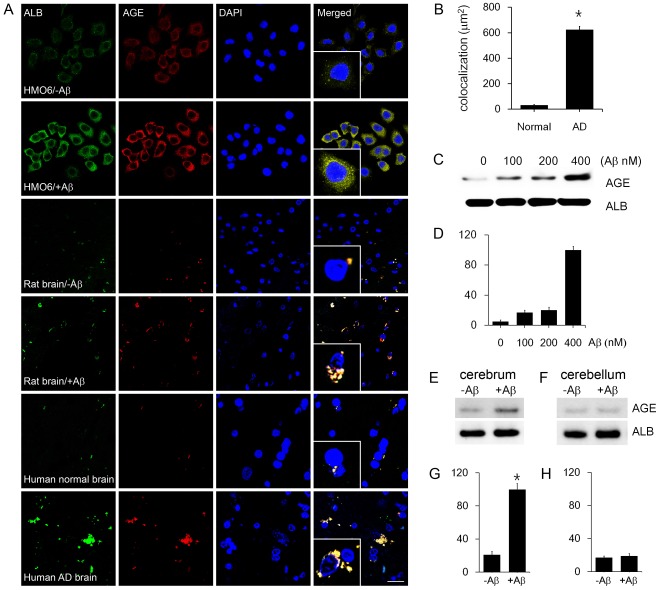
Figure 1. Distribution and synthesis of AGE-albumin in microglial cells and rat or human brains.
(A) Triple-labeled confocal microscopic image analyses were used to study the distribution and relative levels of albumin (green), AGE (red) and DAPI (blue) in the HMO6 microglial cells and entorhinal cortex of rat brains before or after Aβ treatment as well as cerebral cortex of human brains from normal or AD individuals. HMO6 cells and rats were treated with Aβ1–42 described in the Materials and Methods section. Scale bar = 50 µm. These results represent similar images of 5 independent analyses. (B) The AGE-albumin positive particles in cortex of human AD brain were significantly different from the normal brains (p<0.05), as determined by densitometric analysis using Zeiss Zen 2009 software. (C, D) The degree of AGE-albumin synthesis in HMO6 cells was determined by immunoblot analysis (C) and densitometric analysis (D) after exposure to different concentrations of Aβ1–42, as indicated. The level of albumin is shown as an internal control for equal protein loading per lane. (E-H) The immunoblots of AGE-albumin in rat cerebrum (E, G) and cerebellum (F, H), with or without Aβ1–42 treatment and densitometric analyses, are shown. *, significantly different (P<0.001) from the level of AGE-albumin without Aβ1–42 treatment.

