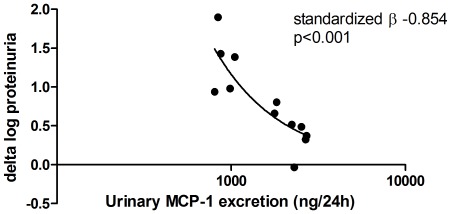
Figure 2. Pre-treatment urinary MCP-1 excretion and treatment response.
Scatter plot indicating the relationship between the 24 h -urinary excretion of MCP-1 before start of anti-proteinuric therapy (i.e. NSAID) and the anti-proteinuric response (i.e. delta proteinuria without vs with NSAID). A negative association is present, suggesting that high baseline MCP-1 excretion is associated with poor anti-proteinuric response to therapy.

