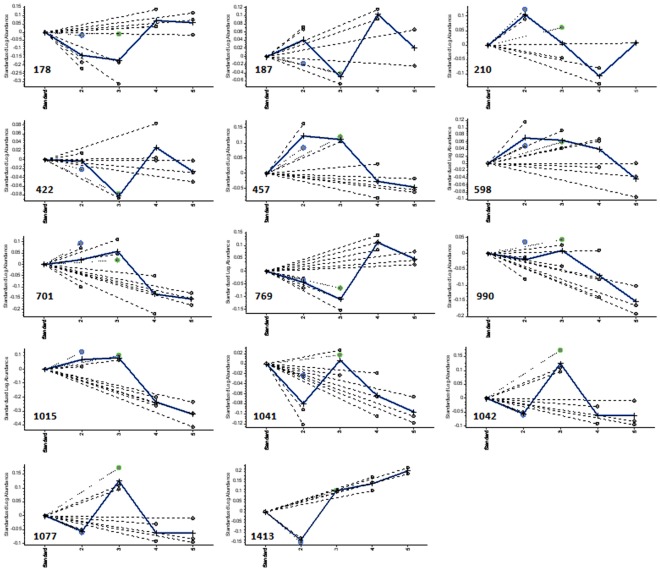
Figure 3. Expression levels and differential expression of some proteins.
Each part of the figure shows the standard log abundance of spots on the y-axis for each protein spot of Groups B, C, D, and E (pool groups 2, 3, 4, and 5, respectively) on the x-axis. The dotted line represents the mean abundance for three repeated measurements in Groups B–D, whereas the continuous line represents the mean abundance for three repeated treatments in any single treatment group.

