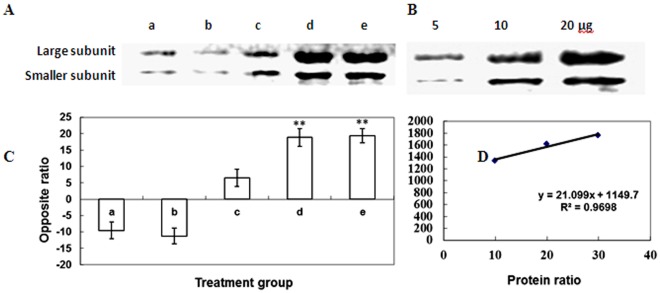
Figure 9. Protein expression analysis of plastid-lipid-associated proteins by western blot.
(A). Semi-quantitative western blot of plastid-lipid-associated proteins. The letters a, b, c, d, and e represent the treatment groups described previously in “Experimental Procedures”. (B) Standard protein samples (5, 10 and 20 µg) were loaded on the well and analyzed by western blotting. (C) Optical density values obtained from the imaging software. The protein ratios were extrapolated using linear regression analysis and expressed as mean ± SD (n = 4). Error bars represent standard deviation (SD). Asterisks indicate values significantly different from the mean at P<0.05. (D) Linear regression was used to quantify the differences between the bands in (B).

