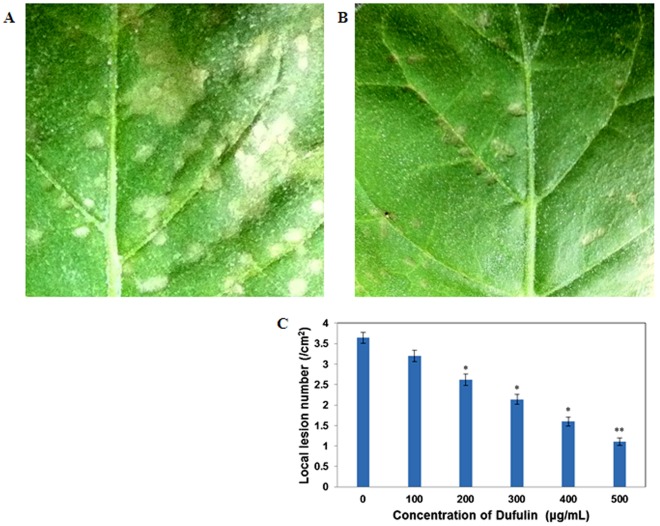
Figure 12. Dufulin-induced virus resistance in N. glutinosa.
(A) Local lesions in the leaves of N. glutinosa after inoculation of 0.05% DMSO solution (the CK treatment group). (B) Local lesions in the leaves of N. glutinosa after inoculation with Dufulin at 500 µg/mL. Small white needle-like points evenly distributed on the leaves represent silicon carbide. (C) Number of local lesions. Values are expressed as the mean of at least 5 replicates. Asterisks indicate statistically significant differences at P<0.05 (*) and P<0.01 (**) when compared with the controls.

