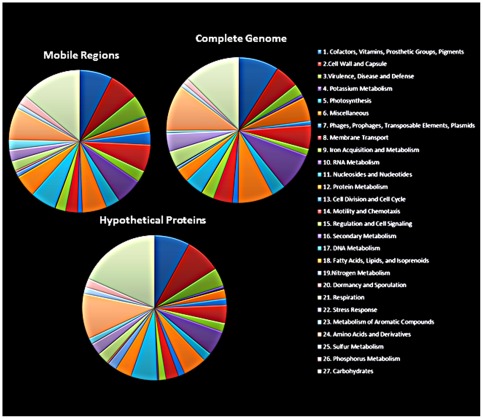
Figure 2. Distribution of the IEC224 genes in Clusters of Orthologous Groups (COG).
Proportional distribution of genes in COGs as assessed by the RAST annotation pipeline [21]. Each color corresponds to a level 1 subsystem (subsystems are described in reference [32]), starting at Cofactors, Vitamins, Prosthetic groups, Pigments (dark blue) and ending with the Carbohydrates subsystem (light gray). In the central pie all of the IEC224 genes were considered, while the upper left pie contains only the genes from mobile genomic regions, and the lower left pie contains the genes from hypothetical proteins that had their function assigned by the Real-Time Metagenomics Portal (see the main text and reference [33]).

