
Figure 3. Deterministic components of the Langevin equation.

Deterministic components of (A) the parallel and (B) the perpendicular acceleration for  (gradient direction), as a function of
  . Black dots show the experimental results, the red lines display fits according to
 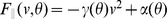 and
and 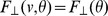 , respectively. (C)
  as a function of
  . The red line shows the fit
 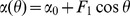 . (D)
. (D)  as a function of
  . The red line shows the fit
 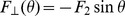 . Error bars indicate the 95% confidence interval on the values of
  and
and  .
.