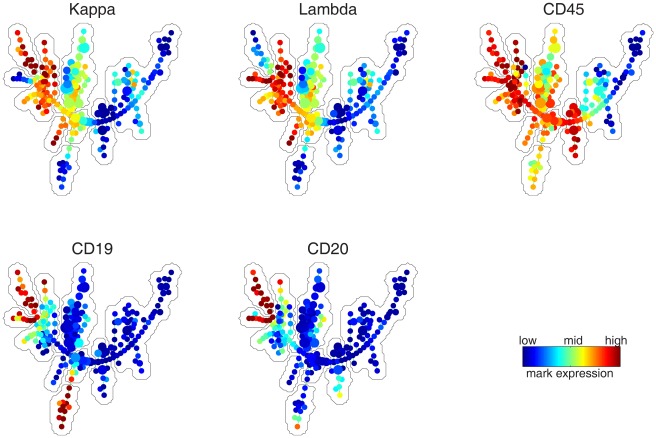
Figure 2. SPADE tree derived from tube 2 data of all 359 samples.
Each tree is colored by the expression of one protein marker in tube 2: kappa, lambda, CD45, CD19 and CD20. Manually derived annotation boundaries are shown by the gray curves that partition the tree. These boundaries facilitate the interpretation of which phenotype is represented by different parts of the tree.

