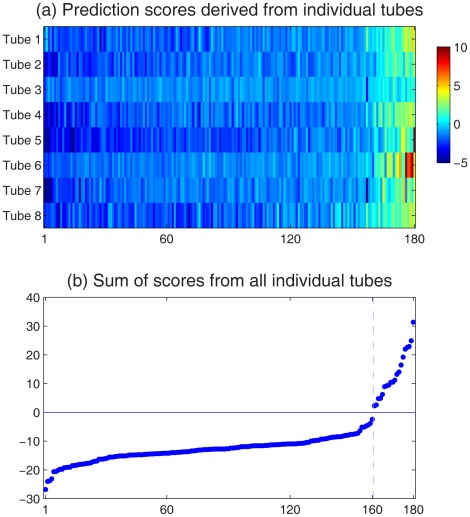
Figure 6. Final prediction scores.
(a) The Relief prediction scores for testing samples, derived from individual tubes. Each row corresponds to one tube. Along the horizontal axis, the 180 testing samples are ordered by sorting the sum of the scores from all 8 tubes. (b) Sum of scores from all 8 tubes. Samples are in the same order as above. The final prediction is made by comparing the scores against the threshold 0. A clear gap can be observed around 0, indicating high confidence of the prediction.

