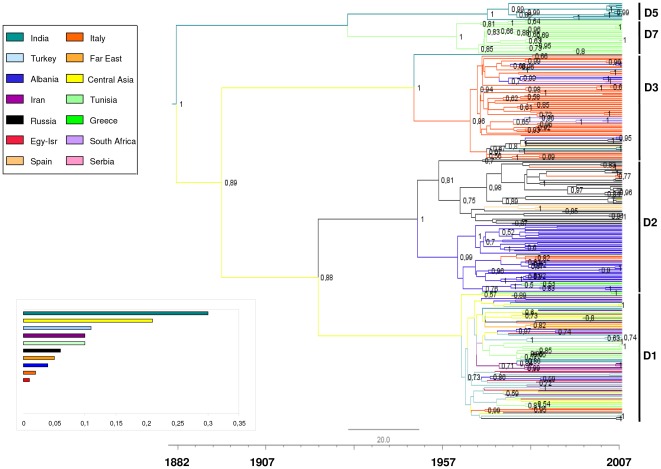
Figure 1. The maximum clade credibility (MCC) tree of HBV-D P gene sequences.
The branches are coloured on the basis of the most probable location state of the descendent nodes (see colour codes in upper left inset). The numbers on the internal nodes represent posterior probabilities, and the scale at the bottom of the tree represents the years before the last sampling time (2007). The clades corresponding to the main HBV-D subgenotypes (D1, D2, D3, D5, D7) are highlighted.

