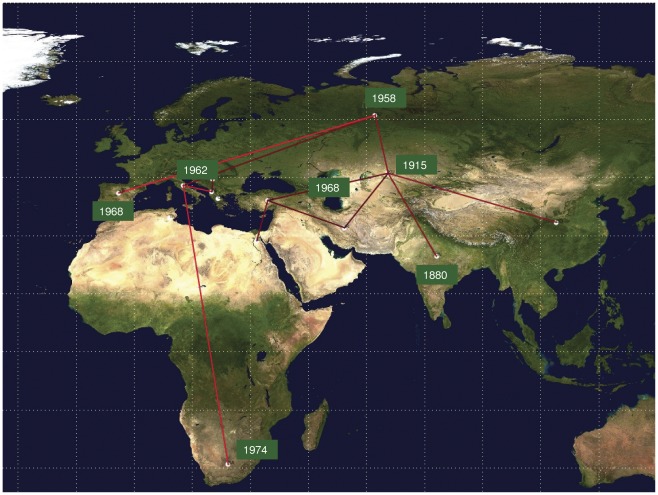
Figure 2. Significant non-zero HBV-D migration rates worldwide.
Only the rates supported by a BF of >6 are shown. The relative strength of the support is indicated by the colour of the lines (from dark red = weak to light red = strong). The map was reconstructed using SPREAD (see Methods).

