Figure 4.
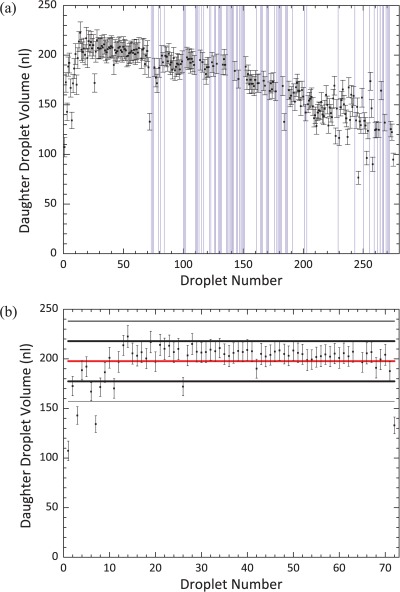
(a) The variation in the volume of dispensed droplets over the device lifetime. A droplet was dispensed from a 2 μl reservoir, its volume was measured, and it was then returned to the reservoir. This process was repeated 275 times. Vertical purple lines have been inserted where the dispensing protocol failed and no daughter droplet was formed. A voltage of 90.0 VAC at 10 kHz was used and electrodes were turned on for 0.5 s. A 120 μm spacer was used in the device. Droplet volume is plotted with respect to droplet number rather than time since dispensing events, although regular, were not equally spaced. (b) The variation in the volume of the first 72 droplets dispensed. The success rate of dispensing was 100%. The red line denotes the mean droplet volume and the thick and thin black lines denote the first and second standard deviation from the mean, respectively. 86% of droplets were within 1 standard deviation of the mean, with a volume variation of 10%.

