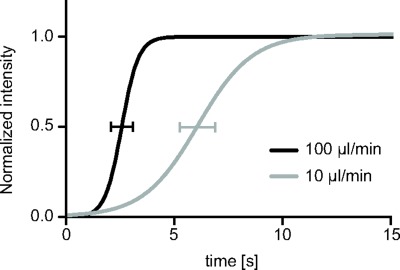
Figure 2.
Dye concentration profiles which results from quantitative evaluation of the color intensity in each image acquired with a camera during the dye delivery. The flow rate was set to 10 μl/min (gray line) and to 100 μl/min (black line). Standard deviation of V50 values of three curves acquired is also added to both profiles. Within few seconds the dye reaches its maximal concentration at both flow rates.

