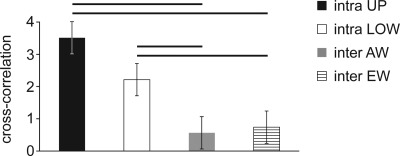
Figure 5.
Cross correlation values inside the upper compartment (black bar) and the lower compartment (white bar). Cross correlation values among electrodes across the wall (gray bar) and among the electrodes placed closest to its end (striped bar). Median and percentiles are shown (n = 3). Each horizontal black line identifies a significant difference (Mann-Whitney, p < 0.05).

