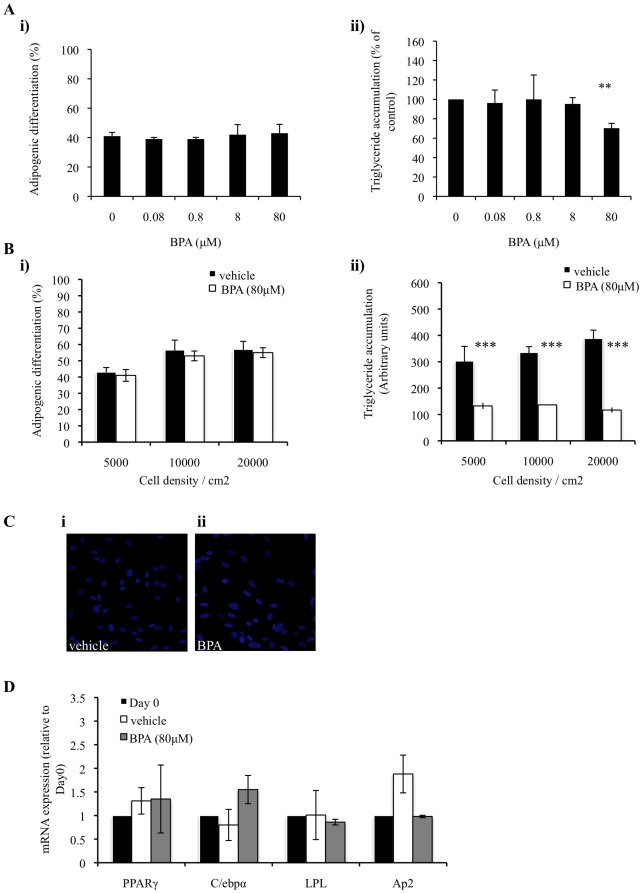
Figure 4. BPA suppresses triglyceride accumulation in pre-differentiated adipocytes and in suboptimal differentiation conditions.
(A) hASCs were grown to confluency (Day 0) and induced to differentiate with an optimised adipocyte differentiation medium in the presence of vehicle or BPA throughout differentiation. On day 14 cultures were fixed and subjected to flourescence microscopy. Merged images of lipid droplets and nuclei were analyzed by image cytometric software. Data generated from the merged image analysis was expressed as adipogenic differentiation (Ai), and triglyceride accumulation (Aii). Data are expressed as mean ±SD (3 independent experiments, >500 cells were analyzed for each experiment). ** p<0.005 (BPA vs. vehicle). (B) Cells were seeded at 5.0×10³ cells/ml, 1.0×10⁴ cells/ml or 2.0×10⁴ cells/ml. 24 hrs later cells were induced to differentiate with an optimised adipocyte differentiation media in the presence 80 µM BPA or vehicle throughout differentiation. On day 14, cultures were fixed and subject to flourescent microscopy. Merged images of lipid droplets (green) and nuclei (blue) were analyzed by image cytometric software. Data generated from image cytometry was expressed as adipogenic differentiation (Bi), and triglyceride accumulation (Bii), as described in methods. Values are mean ± S.D. of three independent experiments. *** P<0.0001 as compared with vehicle control for each day. (C) hASCs were grown to confluency and treated with either 80 µM BPA or vehicle alone for 14 days. Following 14 days cells were stained for lipid droplets (green) and nuclei (blue). (D) hASCs were grown to confluency and treated with either 80 µM BPA or vehicle alone. After 9 days expression of PPARγ, C/EBPα, LPL and aP2 was quantified by qPCR. Data was corrected to GAPDH expression levels and normalized with respect to day0 controls.

