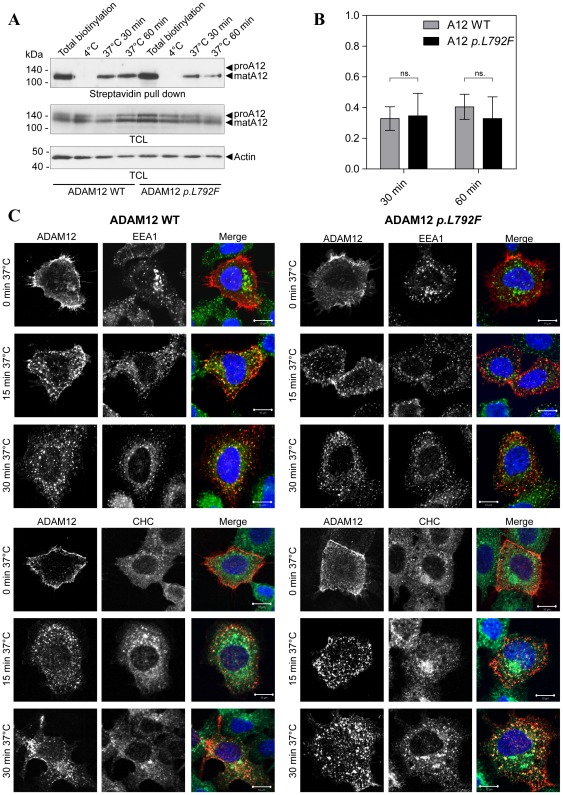
Figure 3. ADAM12 p.L792F localizes to the cell surface and is internalized similarly to wild-type ADAM12.
(A) Biotinylation of cell surface ADAM12 WT or ADAM12 p.L792F. 293VnR cells, transiently transfected with ADAM12-GFP or ADAM12-GFP p.L792F were labeled with NHS-SS-Biotin for 30 min at 4°C, with subsequent incubation at 4°C (controls) or at 37°C for indicated time points. Then, the cells were treated with reducing reagent (glutathione) to remove non-internalized biotin from the cell surface (except for total biotinylation control lane 1). The control samples kept at 4°C were included to ensure proper removal of cell surface biotin. Biotinylated proteins were precipitated with streptavidin-conjugated agarose beads and subjected to western blotting with the appropriate antibodies. The ADAM12-GFP proform (proA12) is ∼150 kDa and the mature form (matA12) is ∼130 kDa. Actin was used as a loading control. TCL: Total cell lysate. (B) Quantitative analysis of ADAM12 internalization where internalized ADAM12-GFP at 30 or 60 min at 37°C were calculated as fold-change compared to total biotinylated ADAM12-GFP for each WT or mutant sample. The data are shown as +/− standard error of the mean (SEM) (n = 5 independent experiments); “ns.” indicates no statistical difference (p>0.05, two-tailed unpaired t-test). (C) ADAM12 WT or ADAM12 p.L792F internalization and co-localization with the early endosomal marker (EEA1) and clathrin heavy chain (CHC). The images show immunofluorescent staining and confocal laser-scanning microscopy of 293VnR cells transiently transfected with ADAM12 WT or the p.L792F mutant and seeded onto FBS-coated coverslips. Cells were labeled with ADAM12 monoclonal antibody 6E6 for 1 hour at 4°C, washed, and incubated in culture medium for 15 min or 30 min, followed by fixation and permeabilization. Cells were then stained with an EEA1 antibody (top three panels) or CHC antibody (bottom three panels) for 1 h at RT and subsequently with appropriate secondary antibodies and DAPI (n = 2). Merged images show partial co-localization of ADAM12 and EEA1 or CHC. Scale bar = 10 µm.

