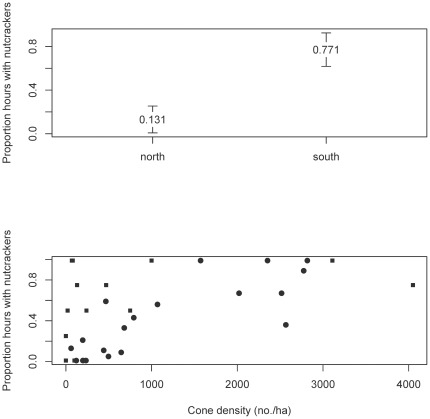
Figure 4. Upper panel: Average number of Clark's nutcrackers observed per transect in the two study area regions.
Error bars indicate extent of 95% confidence intervals. Lower panel: proportion of observation hours resulting in an observation of Clark's nutcracker as related to average density of whitebark pine cones on survey plots sampled in this study (squares) combined with those sampled in [14] (circles).

