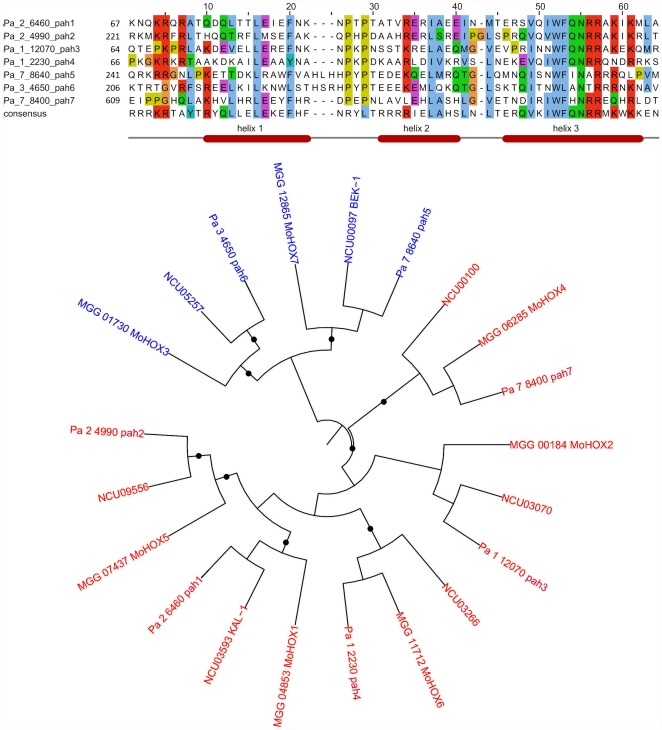
Figure 2. Evolution of HD transcription factors in Sordariomycetes.
Top, alignment of the HD domains of the P. anserina HD transcription factors. The alignment was obtained with ClustalW2 [49] and colored according to the ClustalX color scheme provided by Jalview [50]. Numbers indicate the position in the protein of the first amino acids of the homeodomains. The bottom consensus line and the secondary structure are according to [9]. Bottom, PhyML tree of the HD factors of P. anserina, N. crassa and M. grisea. Black dots indicate statistically supported branches (>80%, 200 bootstraps). Non-TALE HD in red, TALE HD in blue.

