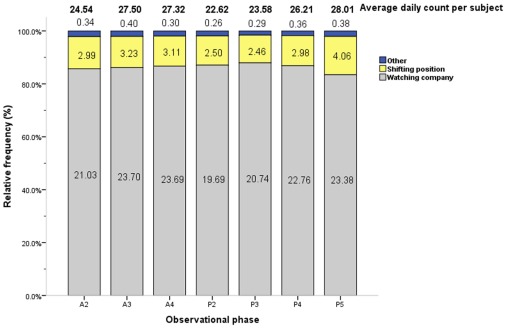
Figure 6. Average counts and relative frequencies of conflict and vigilance behaviors by observational phase.
The average daily count per subject (total no. of actions/40 subjects/4 days) and relative frequencies of each conflict and vigilance behavior are displayed by phase. Each figure in related color bar represents the average daily frequencies of respective action per subject in each phase(total no. of actions/40 subjects/4 days). Phase timing: A2 = 10:00–10:30, A3 = 10:30–11:00, A4 = 11:00–11:30, P2 = 14:30–15:00, P3 = 15:00–15:30, P4 = 15:30–16:00, P5 = 16:00–16:30.

