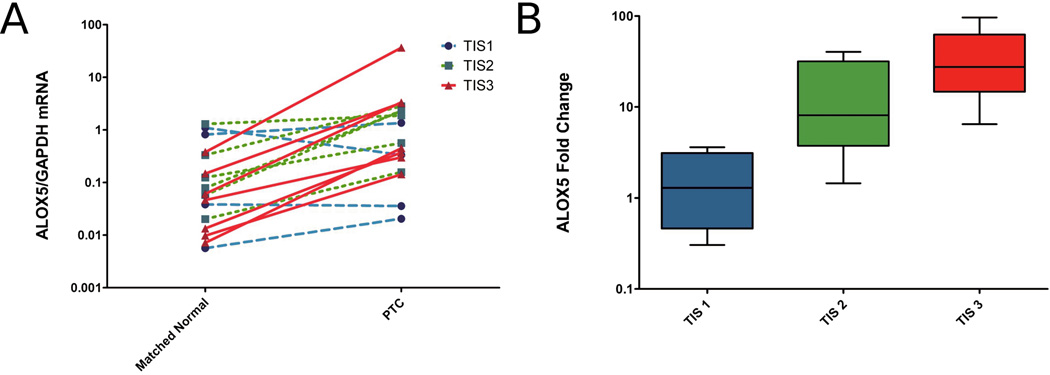
Figure 1.
ALOX5 mRNA expression correlates with tumor invasiveness. (A) GAPDH normalized ALOX5 expression in 17 pairs of PTC and patient-matched, normal thyroid tissue measured by quantitative real-time RT-PCR. Data points represent average values of samples run in triplicate, lines link tumor and patient-matched, normal thyroid pairs, and colored line depicts TIS value (blue=TIS1, green=TIS2, red=TIS3). Mean ALOX5/GAPDH mRNA for patient-matched, normal samples is 0.27±0.10, and for PTC is 3.291±2.089; p =0.0024 (Wilcoxon signed rank test). (B) Box plot of the tumor-to-normal fold difference in ALOX5 expression stratified by TIS, demonstrate a positive Spearman correlation (rs=0.74, p= 0.0007; TIS1 n=4, TIS2 n=5, TIS3 n=8).

