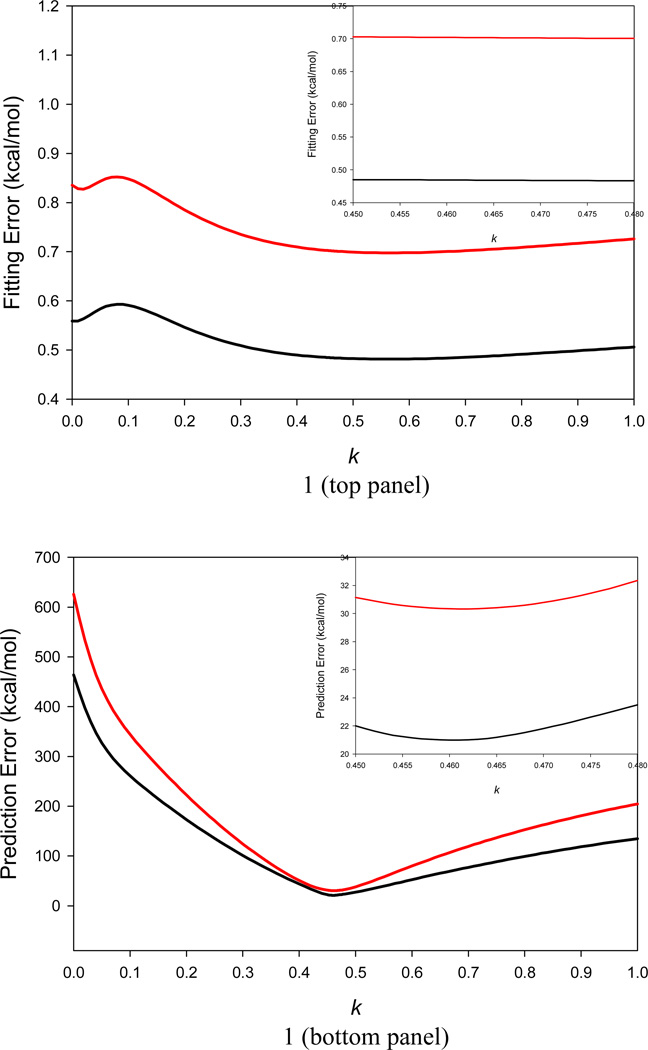
Figure 1.
Application of a two-step systematic search to scan the k parameter in Eq. 4. An ideal k value is recognized when the RMS error of conformational entropy by linear regression analysis for small molecules in Data Set I and the RMS error between the NMA TS and WSAS TS of biomolecules in Data Sets II and III are simultaneously minimized. It is shown that the AUE (black) and RMSE (red) of TS by linear regression analysis using Data Set I are almost unchanged for k from 0.45 to 0.48 (top panel); similarly, the AUE (black) and RMSE (red) between the NMA TS and WSAS TS of biomolecules in Data Sets II and III approach their minimum for k from 0.45 to 0.48 (bottom panel). Thus, the ideal k parameter is set to 0.461.

