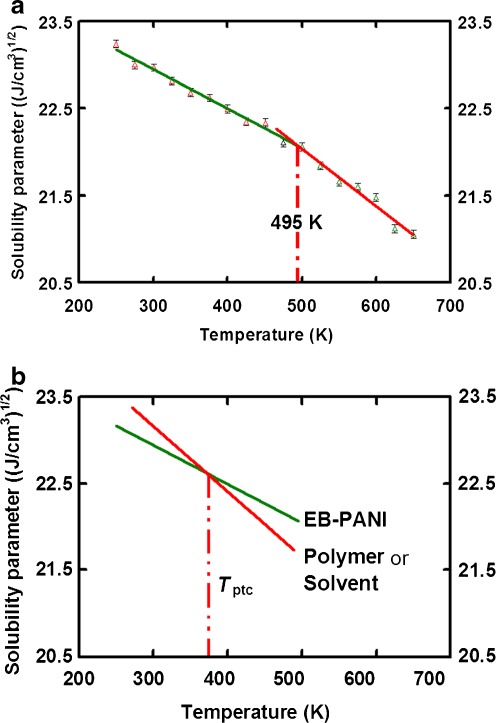
Fig. 5.
a Plots of solubility parameter against temperature. There is a break at T = 495 K in the plot, which indicates the occurrence of glass-rubber transition. Experimental glass transition temperature of T g = 473 K [33] or 523 K [34]. b An example to determine the suitable processing temperature condition (T ptc) by using the δ–T curve. The EB–PANI has the best miscibility (or best solubility) with the target polymer (or solvent) at T ptc

