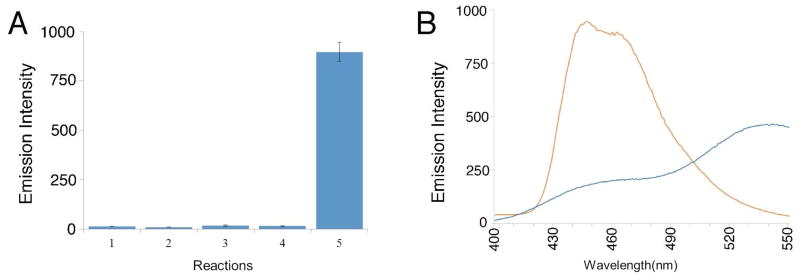
Figure 1.
Conversion of 1 into a fluorescent product under hypoxic conditions. A. Fluorescence emission at 445 nm (λex 307 nm) for: (1) a control sample of compound 1 alone (0.8 mM), (2) a control reaction composed of NADPH:cytochrome P450 reductase (1.1 U/mL), NADPH (2.4 mM), and a non-fluorescent electron acceptor 1,2,4-benzotriazine 1,4-dioxide35 (6.4 mM) under aerobic conditions, (3) a control reaction composed of NADPH:cytochrome P450 reductase (1.1 U/mL), NADPH (2.4 mM), and a non-fluorescent electron acceptor 1,2,4-benzotriazine 1,4-dioxide35 (6.4 mM) under anaerobic conditions, (4) compound 1 (0.8 mM) + NADPH:cytochrome P450 reductase (1.1 U/mL) and NADPH (2.4 mM) under aerobic conditions, (5) compound 1 (0.8 mM) + cytochrome P450 reductase (1.1 U/mL) and NADPH (2.4 mM) under anaerobic conditions. Reactions were incubated for 18 h in sodium phosphate buffer at (12 mM, pH 7.4) at 24 °C, then diluted with aerobic sodium phosphate buffer (12 mM, pH 7.4), and the fluorescence measured (λex 307 nm, λem 445 nm). It is important to note that NADPH exhibits fluorescence with an emission maximum at 445 nm. However, control experiments showed that unconsumed NADPH in the assays was ultimately converted to the non-fluorescent NADP+ product by enzyme-driven redox cycling upon opening the reaction vessel to air and dilution with aerobic buffer prior to fluorescence measurements (Figure S2). B. Fluorescence spectrum of the reaction mixture generated in the anaerobic metabolism of 1 by NADPH:cytochrome P450 reductase as described for reaction 5 above (orange line, with emission maxima at 440 and 450 nm) and fluorescence spectrum of authentic 6-aminoquinoline (2, 50 μM, λex 340 nm, in sodium phosphate buffer, 10 mM, pH 7.4).

