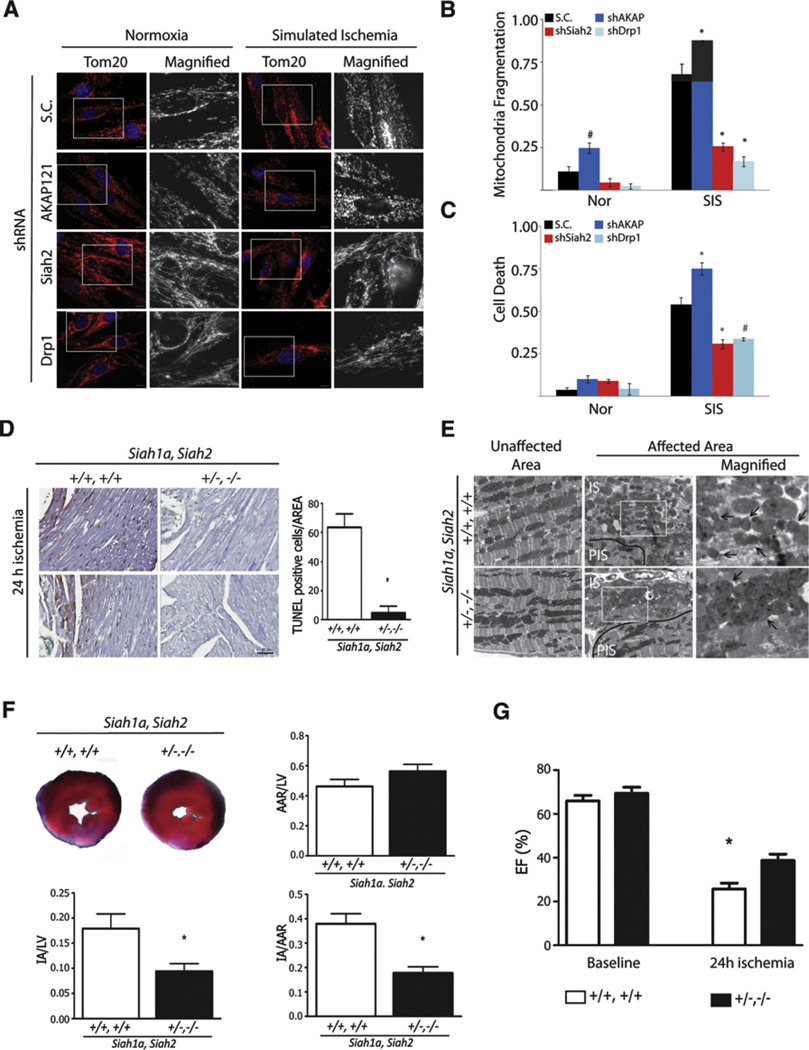
Figure 6. Siah2 Controls Ischemia-Mediated Remodeling of Mitochondria Dynamics and Cell Death of Cardiomyocytes In Vitro and In Vivo.
(A–C) H9C2 cells subjected to knockdown with scrambled (S.C.) or shRNA against indicated genes was incubated under normoxia or simulated ischemia for 6 hr. (A) The morphology of mitochondria was visualized with anti-Tom20 antibody and (B) quantified by counting cells (200–300 cells) with fragmented mitochondria in three independent experiments. Data are presented as mean ± SD (C) Cell death was assessed by propidium iodide staining. Death rate was quantified by counting the number of cells with PI-positive signal per total number of cells of ten different fields (100 cells) in three independent experiments. Data are presented as mean ± SD. The asterisks and fountains indicate p < 0.005 and p < 0.05, respectively.
(D) Representative images of histological sections of left ventricular myocardium from Siah1aWT/2WT and Siah1aHT/2KO mice 24 hr after myocardial infarction (MI). The TUNEL-positive cells in the area are quantified on three consecutive images of the AAR (n = 2 or 3 animals per Siah1aWT/2WT or Siah1aHT/2KO, respectively). Data are represented as mean ± SD. Scale bar indicates 50 µm.
(E) Ultrastructure of ventricular myocardium tissues from Siah1aWT/2WT and Siah1aHT/2KO mice exposed to 24 hr of myocardial infarction represent unaffected and affected areas. PIS and IS indicate peri-ischemic and ischemic regions, respectively. Scale bars indicate 5 µm. The arrows indicate mitochondria.
(F) (Upper left) Representative images of slices of ventricular myocardium from Siah1aWT/2WT and Siah1aHT/2KO mice 24 hr after myocardial infarction. The ratio of area at risk (AAR) to LV (left ventricle) (upper right), ratio of IA (infract area) to LV (lower left), and ratio of IA to AAR (lower right) were quantified.
(G) Ejection fraction percent (EF%) was calculated from echocardiographic images at 24 hr post-MI (see the Supplemental Experimental Procedures and the supplemental movies). Note the less impaired cardiac function of the double mutant Siah1aHT/Siah2KO relative to Siah1aWT/Siah2WT littermates post-MI. For (F) and (G), n = 3 animals per each genotype. Data are presented as mean ± SD. The asterisk indicates p < 0.05.

