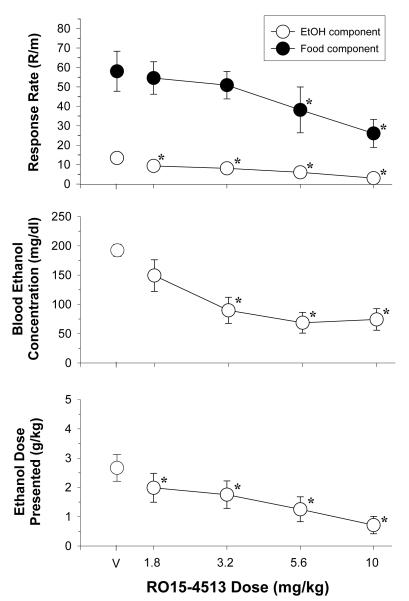
Fig. 4.
Effects of acute administration of rauwolscine in 7 rats responding under a multiple schedule of food and ethanol presentation. Unfilled circles represent response rate during the ethanol component, whereas filled circles represent response rate during the food component. The dependent measures were response rate (response/min), blood ethanol concentration (mg/dl), and dose of ethanol presented (g/kg). The mean rate of responding for food was 49.90 ± 13.75 responses/min, whereas the mean rate of responding for ethanol was 9.30 ± 1.57 responses/min. Letters indicate significant differences among doses. For further detail, see legend for Fig. 3.

