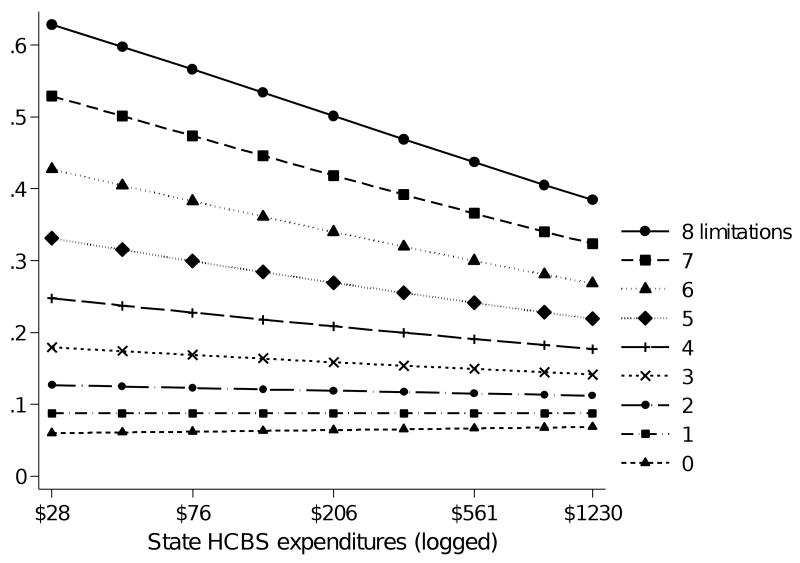
Figure 1.
Interaction between state HCBS and intra-individual means of daily activity limitations (Based on Model 2)
Notes: HCBS=Home and Community-Based Services. The x-axis indicates a log scale of the level of states' annual expenditures on HCBS per person aged 65+, ranging from the lowest level to the highest level in our analytic sample. The y-axis indicates the predicted probability of depression for an “average” married white woman, fixing the values of independent variables at mean levels for continuous variables (Table 1) and 0 for dichotomous variables.

