Fig. 2.
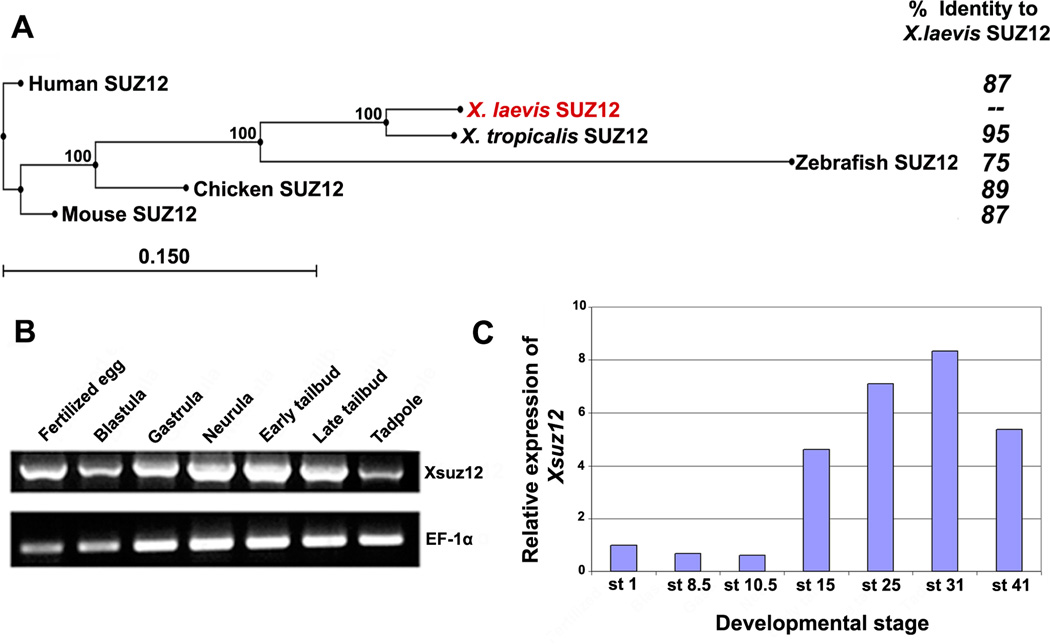
A: Phylogenetic tree of SUZ12 proteins of different species created by neighbor-joining algorithm using CLC Sequence Viewer, and their respective amino acid identity compared to X. laevis Suz12. Percentage of branching point reproducibility is listed next to each node. Scale bar represents distance calculated on the basis of amino acid substitution rates. B: RT-PCR analysis of Xsuz12 expression during the frog development. cDNA pools were prepared from the following stages: Fertilized egg: stage 1, Blastula: stage 8–9, Gastrula: stage 10.5, Neurula: stage 14–18, Early tailbud: stage 25, Late tailbud; stage 35, Tadpole: stage 41. EF1-α was used as a loading control. C: Relative amounts of Xsuz12 transcripts during Xenopus development as revealed by qRT-PCR. The values of Xsuz12 was normalized to those of H4. Bars represent fold change in Xsuz12 expression at different stages as compared to stage 1.

