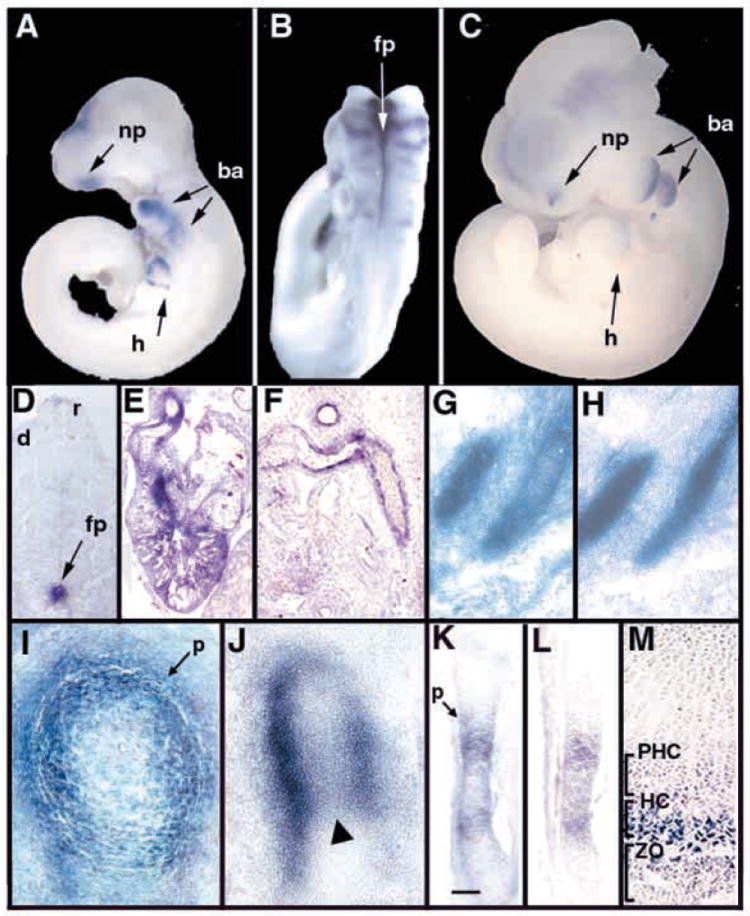
Fig. 1.

Expression of Ctgf in midgestation embryos. Whole-mount in situ hybridization of E9.5 (A,B) and an E10.5 (C) embryo treated with antisense Ctgf, demonstrating expression in heart, branchial arches, neuronal tissues and nasal process. (D) Frontal section through an E11.5 embryo showing high levels of Ctgf expression in the floorplate, and lower levels in the roofplate and dermomyotome. (E) Ctgf expression in the heart at E13.5. Transcripts are present in ventricular myofibroblasts and in fusing endocardial cushion tissue at the midline of the outflow tract. (F) Ctgf expression in the endothelium and smooth muscle layers of major blood vessels at E13.5. (G,H) Adjacent parasagittal sections through E12.5 ribs showing Ctgf expression in perichondrium (G) and collagen type II (ColII) (H) expression in proliferating chondrocytes. (I) Transverse section through an E13.5 femur showing Ctgf expression in perichondrium and in adjacent chondrocytes. (J) Sagittal section through the femur of an E13.5 embryo showing strong Ctgf expression in the perichondrium, and lower levels in chondrocytes at the center of the diaphysis (arrowhead). (K-M) Adjacent sections though an E14.5 femur showing expression of Ctgf (K), and Ihh (L). Scale bar in K: 100 μm for K,L. Ctgf is expressed in the domain of Ihh expression, as well as in prehypertrophic chondrocytes adjacent to the perichondrium. (M) Section through the proximal growth plate of a P0 femur, showing Ctgf expression in hypertrophic chondrocytes. ba, branchial arch; d, dermomyotome; fp, floorplate; h, heart; HC, hypertrophic chondrocytes; m, meninges; np, nasal process; p, perichondrium; PHC, prehypertrophic chondrocytes; r, roofplate; sc, spinal cord; ZO, zone of ossification.
