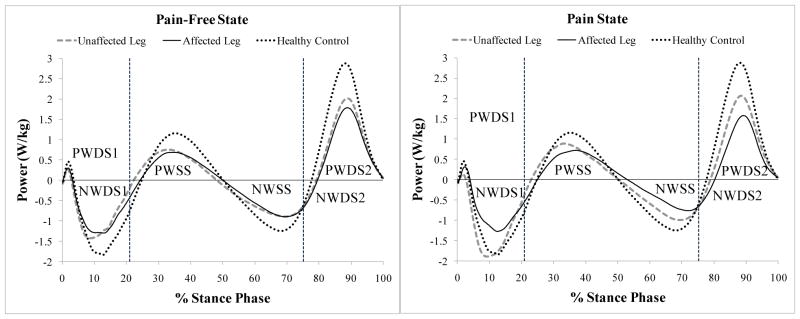
Figure 1.
Mean ensemble curves for external work (integral of power-time plot). Plots have been normalized to 100% stance phase. Power is normalized to body mass. Vertical dashed lines denote average timing for end of initial double support and beginning of terminal double support. In the pain state, the unaffected leg is doing more work throughout the stance phase as the affected leg takes on less work.
PWDS1, positive work initial double support; NWDS1, negative work initial double support; PWSS, positive work single support; NWSS, negative work single support; PWDS2, positive work terminal double support; NWDS2, negative work terminal double support; TotPW, total positive work through entire stance; TotNW, total negative work through entire stance.
Initial double support corresponds to early stance loading for lead leg. Terminal double support corresponds to push-off for trailing leg.

