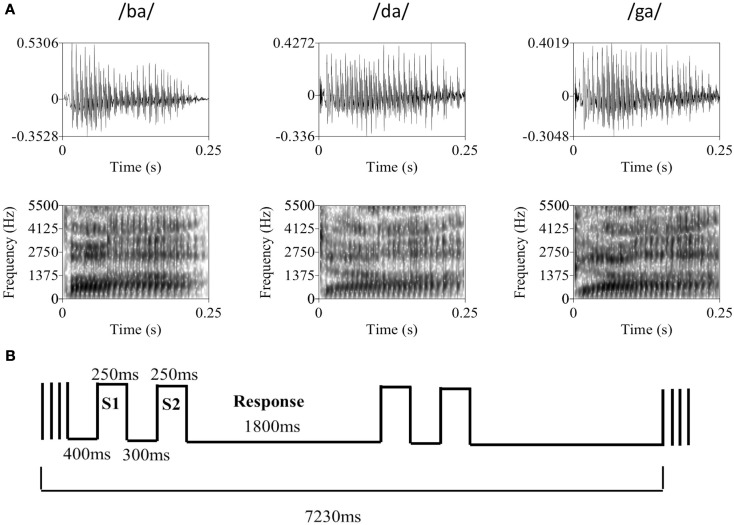
Figure 1.
(A) Representative tokens from each of the three syllable categories used in the discrimination task. The top row contains the raw waveforms for each token with amplitude (y-axis) plotted against time (x-axis). The bottom row contains the associated spectrograms for each token with frequency in Hz (y-axis) plotted against time (x-axis), where darker sections indicate greater sound energy. During the experiment, auditory syllable stimuli were presented in broadband Gaussian noise at a constant level of 62 dB SPL. Syllable amplitude was held constant at the psychophysically determined threshold level (mean SNR = −13.1 dB). (B) The basic trial and block structure of the fMRI experiment. Each block consisted of two same-different discrimination trials with 250 ms auditory syllable presentations separated by a 300-ms ISI. Subjects had 1800 ms to respond. Trials occurred in the silent period between 1630 ms volume acquisitions, with a 400 ms silent period at the beginning of each block of two trials.

