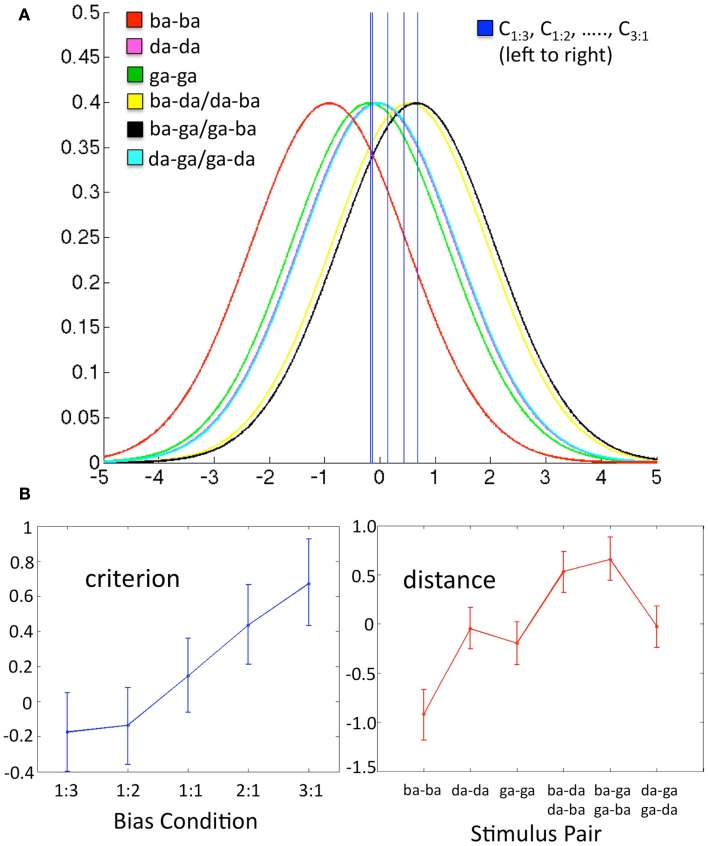
Figure 2.
Data in each panel are from a representative subject. (A) Schematic of the decision space including six conditional Gaussian distributions (one for each stimulus pair) representing the likelihood of observing a given sensory response, and five criterion values (one for each bias ratio condition), where C0.333, C0.5, …., C3, fall left to right on the graph. The x-axis is the value of a difference-strength statistic representing the perceptual difference between two substimuli in a pair. The y-axis is the probability of observing a given value of the difference-strength statistic. For a given bias ratio condition, values of the difference-strength statistic that fall above (right of) the criterion line yield a “different” response, while values that fall below (left of) the criterion yield a “same” response. The positions of the six stimulus pair distributions remain fixed across conditions. Note that the magenta (da-da) and teal (da-ga/ga-da) distributions fall roughly on top of one another, as do the criteria for the 1:3 and 1:2 bias ratio conditions. (B) Model estimates (over all q = proportion of different trials, k = stimulus pair) for Cq (criterion, left) and μk (distance, right) plotted as line graphs with the Bayesian 95% credible intervals plotted as error bars. These values reflect the five criterion lines and the means of the six stimulus pair distributions plotted in (A) above, respectively.

