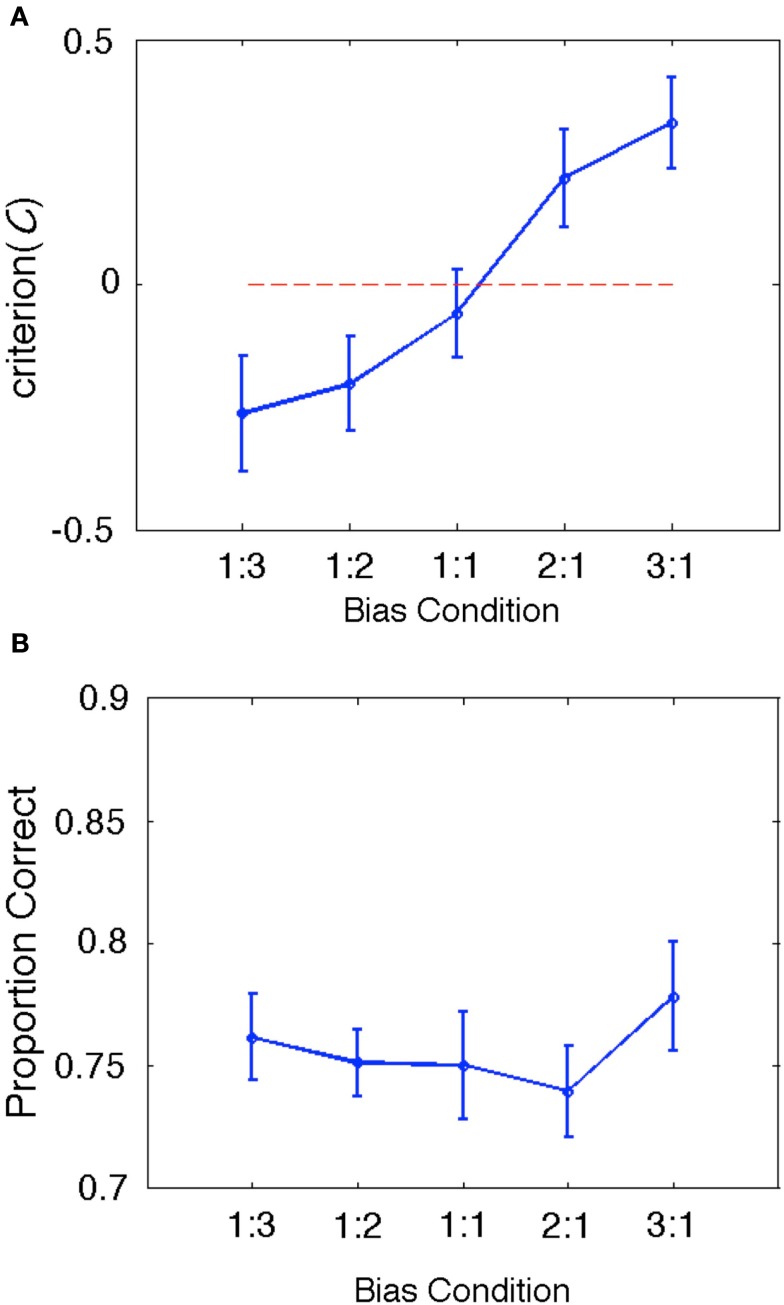
Figure 3.
(A) Group behavioral results for our bias measure, C. The data are plotted as a line graph where the x-axis is the same-different ratio and the y-axis is the group mean value of C. Error bars reflect ± one standard error of the mean. The zero criterion value (no bias) is plotted as a dotted line in red. Clearly, C varies significantly in the expected direction (negative values indicate bias toward responding “different” and positive values indicate bias toward responding “same”). Also, the mean criterion value in the 1:1 bias ratio condition is closest to zero (and contains zero within ±1SE), as expected. (B) Group behavioral results for proportion correct (PC). Although PC varied slightly across conditions, this variability is likely accounted for by shifts in bias, which affect PC but not bias-corrected measures like d′.

