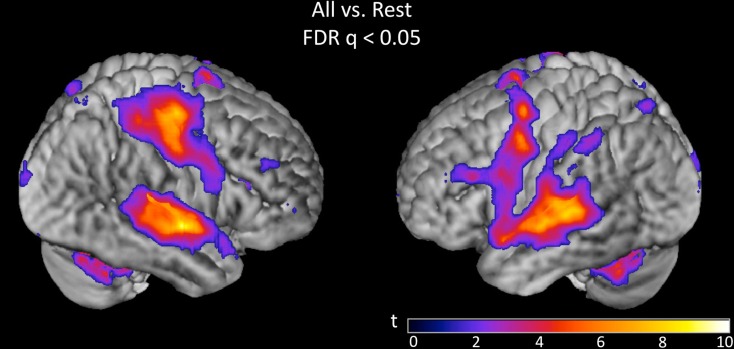
Figure 4.
Group (n = 15) t-map for the contrast corresponding to mean activation in the syllable discrimination task (versus rest) across all five bias ratio conditions. The statistical image was thresholded at FDR-corrected q < 0.05. The set of voxels identified in this contrast were used as a mask for all subsequent analyses.

