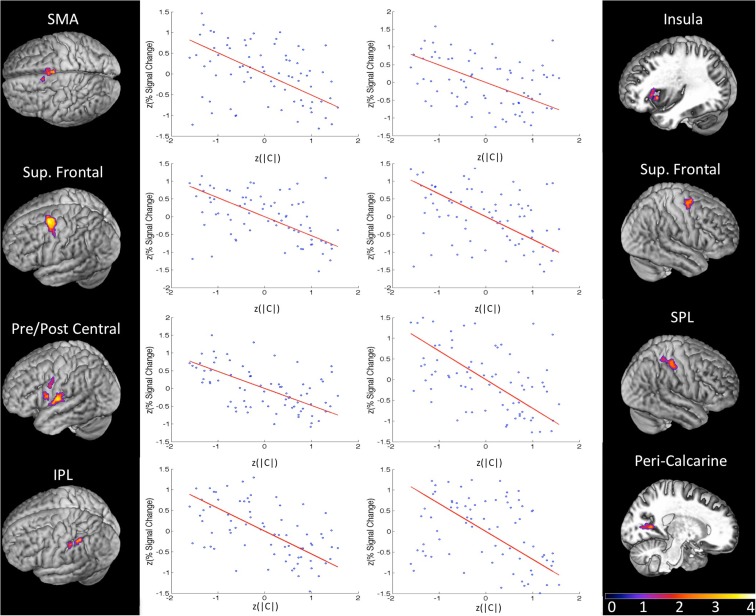
Figure 5.
Group results (z-maps, where FDR q values are converted to z-scores) for the orthogonal regression of response bias (|C|) on BOLD percent signal change (PSC). Each region pictured was significant at FDR-corrected q < 0.01 with a minimum cluster size of 20 voxels. Next to each significant cluster is a scatter plot of normalized bias score (x-axis) against normalized PSC (averaged across all voxels in the region). Each plot contains five data points from each of the 15 subjects (blue) corresponding to the five same-different ratio conditions in the syllable discrimination experiment. The orthogonal least squares fit is plotted in red. There is a strong negative relationship between response bias and PSC in every region of this fronto-parietal network.

