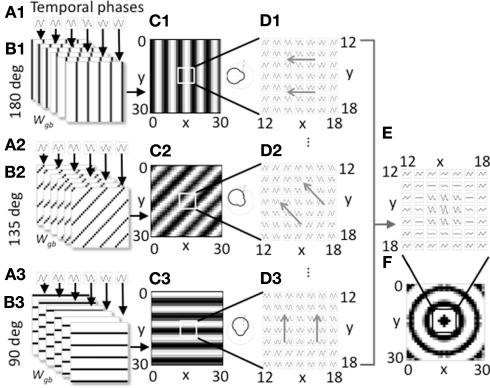
Figure 1.
Overview of model components for a single spatial phase. (A1–A3). Three groups of heading angle cells described by Eq. 1 show oscillations over time with different temporal phases (six phases shown). (B1–B3) The three groups project to grid cells with synaptic connectivity that depends on the six different temporal phases and the heading angles of 180° (B1), 135° (B2), and 90° (B3). Only 3 of 24 heading angles are shown. Connectivity also depends upon spatial phase. The groups shown all code a single spatial phase. (C1–C3) At a single time t, the synaptic input to the grid cell population from a full set of temporal phases coding an individual heading angle and spatial phase contains bands of higher amplitude (black). The polar plots on the right show how the output amplitude for each heading angle will change dependent on the direction of movement. (D1–D3) The full time course plotted for a 7 by 7 array of synaptic inputs shows that they oscillate over time with different temporal phases and align to form different spatial bands. Different spatial phases reach the peak of the oscillation at different times resulting in a shift in the bands over time in the direction of the gray arrows. (E) Synaptic input to a 7 by 7 array of grid cells is shown summed across all heading angles for a group of cells coding the spatial phase in the center of the grid cell plane (x = 15, y = 15). (F) At a single point in time, for this single spatial phase, the distribution of synaptic input to the full 30 by 30 array of the grid cell plane when summed over all heading angles has a circularly symmetric pattern.

