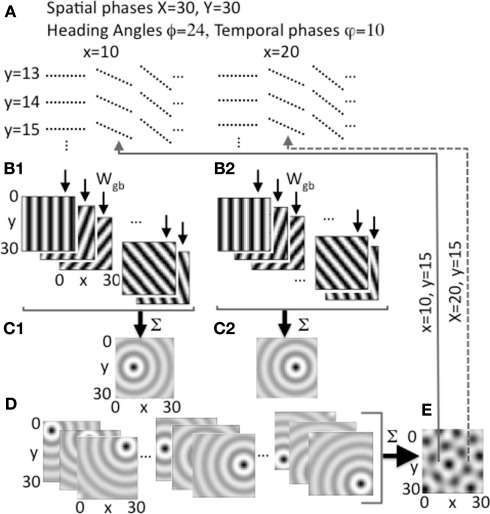
Figure 2.
Heading angle input across the full range of spatial phases. (A) Each spatial phase (x, y) is coded by a heading angle array that includes 24 different heading angles with 10 different temporal phases in each heading angle. Examples show 3 out of 24 angles for individual spatial phases y = 13, 14, 15 and x = 10, 20, with 10 temporal phases (dashed lines) for each angle. (B1,B2) Examples show synaptic output to the grid cell plane from different heading angle cell groups coding 5 out of 24 angles for a single spatial phase at a single point in time t, with bands of higher amplitude synaptic input shown in black. (B1) Shows example output for a single pair of spatial phases x = 10, y = 15, and (B2) shows output for x = 20, y = 15. (C1) Sum of all heading angle output plotted at a single time t for a single spatial phase (x = 10, y = 15). The sum over heading angles creates an amplitude pattern of circles in the grid cell plane centered on the grid cell spatial phase x = 10, y = 15. (C2) The sum of the synaptic output over all heading angles for spatial phase x = 20, y = 15. (D) Examples show synaptic output for a range of different spatial phases (left: y = 5, x = 5, 15, 25; center: y = 15, x = 5, 15, 25; right: y = 25, x = 5, 15, 25). (E) The synaptic output from heading angles is summed across all spatial phases in the grid cell plane. The example shows that differences in the relative amplitude of the heading angle input will result in a grid cell pattern. Arrows show examples of feedback from individual grid cells in the grid cell plane that project back to regulate input from heading angle cell arrays coding x = 10, y = 15 (solid line) and x = 20, y = 15 (dashed line).

