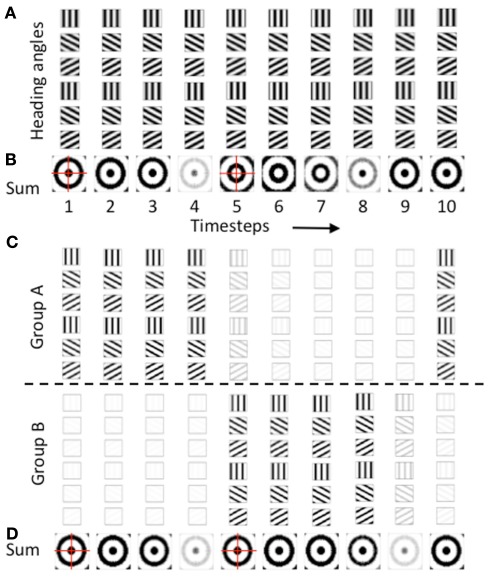
Figure 6.
Temporal dynamics of heading angle cells and synaptic input to grid cells. (A) The synaptic output of heading angle cells coding one spatial phase (px = 15, py = 15) are shown for each of 10 time steps, with each column showing the same 6 headings (18 out of 24 headings are not shown). Note that due to the different temporal phases, the pattern of activity shifts in the direction of the heading angle on each time step. (B) Sum of synaptic input results in a standing wave of oscillations with a circularly symmetric pattern. On timesteps 1–4, the pattern has maximal activity in the center (spatial phase px = 15, py = 15) and has one ring outside the center. On timesteps 5–7, the sum of heading angle outputs results in the opposite pattern. (C) Use of two separate populations of heading angle cells overcomes this problem. On timesteps 1–4, Group (A) shows output activity with a maximum in the center (px = 15, py = 15). On timesteps 5–9, Group (A) is decreased and group (B) is increased in activity to give a similar synaptic input to the grid cell population. (D) With two groups, the synaptic input from the heading angle cells is similar in pattern at most times.

