Figure 6.
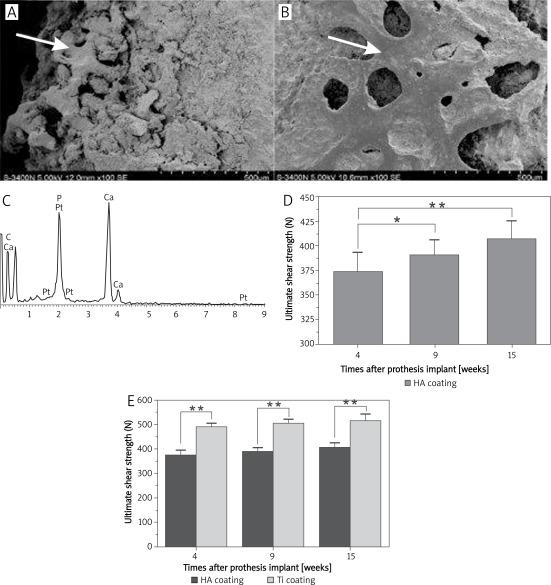
The image of SEM observation and EDX analysis and the comparison of ultimate shear strength on HA and Ti coated prostheses at different times after implantation. A – SEM observation of the surface tissues of HA-coated prostheses 4 weeks after implantation; B – SEM observation of the surface tissues of Ti-coated prostheses 4 weeks after implantation; C – EDX analysis image of the new tissues on surfaces of the two coatings; D – ultimate shear strength on HA-coated prostheses at different times after implantation (**p < 0.01, *p > 0.05); E – comparison of ultimate shear strength between two groups at the same stage after implantation (**p < 0.01)

