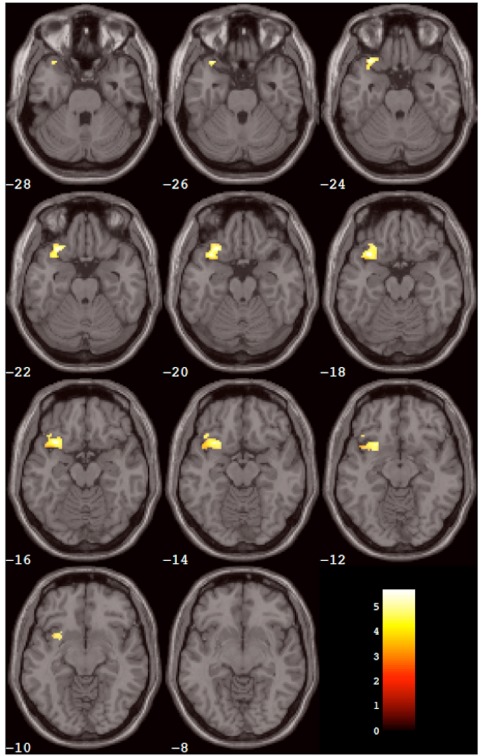
Figure 2.
Results of the within-group analysis. The cluster of voxels (from Table 2) that showed significantly greater activation after SYN115 compared to placebo within the SYN group is depicted in color overlaid on a montage of slices from the standard MNI brain in gray. The slices progress from inferior slices in the left upper corner of the window to superior slices in the right lower corner of the window. The number in white below each slice is the MNI Z coordinate in mm for that slice. The left hemisphere is on the reader’s left-hand side of each slice. The color scale is in the right lower corner of the window and is in units of the t statistic.

