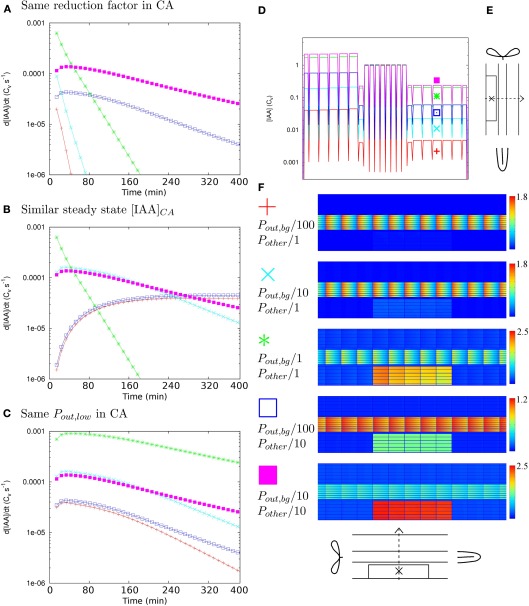
Figure 3.
Determinants of time scales. To determine what factor governs the time scales of auxin accumulation in the controlled area (CA in the scope of this figure) under Effl↓ we followed the changes in the auxin concentration over time in five different reference segments, created by reducing the effective permeabilities with different factors for Pout,bg and all others (Pother = {Pout,low, Pout,high, Pin}). (A–C) Each graph shows simulations that share a common factor. If all five curves have a similar shape, this common factor is the most likely key determinant of the auxin accumulation time scales. (A–C) In the most central cell of the CA [indicated with “X” in (E)]. (A) Ten-fold (further) reduction of efflux inside the CA. Steady state profiles and overviews matching these curves in (D,F) respectively. (B) Similar steady state [IAA] in the CA: [IAA]CA ≈ 2–6 Cv. (C) Pout,low = 0.05 μm s−1 inside the CA. (D) Steady state [IAA] profile along the dotted line in (E) for all curves in (A). (F) Legend for all: Pout,bg/100, Pother/1 red pluses, Pout,bg/10, Pother/1 cyan crosses, Pout,bg/1, Pother/1 (original DZ segment) green asterisks, Pout,bg/100, Pother/10 blue open squares, Pout,bg/10, Pother/10 magenta filled squares, next to steady states for the curves in (A). Note that only in (C) all five curves show a similar shape. This implies that the value of Pout,low in the CA, which governs the distribution of auxin over the CA, is the key determinant of the time scales of local auxin accumulation under Effl↓.

