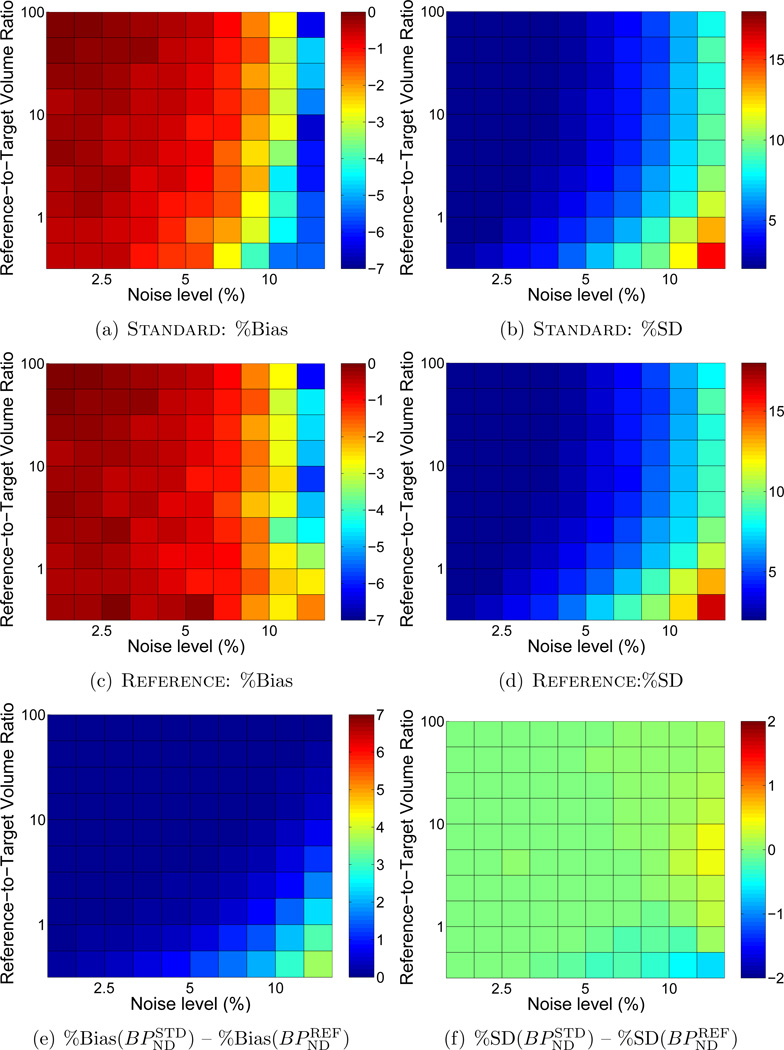
Figure 3.
Comparison of BPND estimated with Standard or Reference (R1 fixed) weighting using MRTM, presented as in Figure 1. (a), (c), and (e) share a common scale. (b) and (d) are scaled alike, but (f) spans a smaller range to aid visualization. Bias and standard deviation are expressed as percentages relative to the true value of BPND. Figure C2 presents a subset of these results for selected region sizes as plots of bias ± s.d. as a function of noise level.

