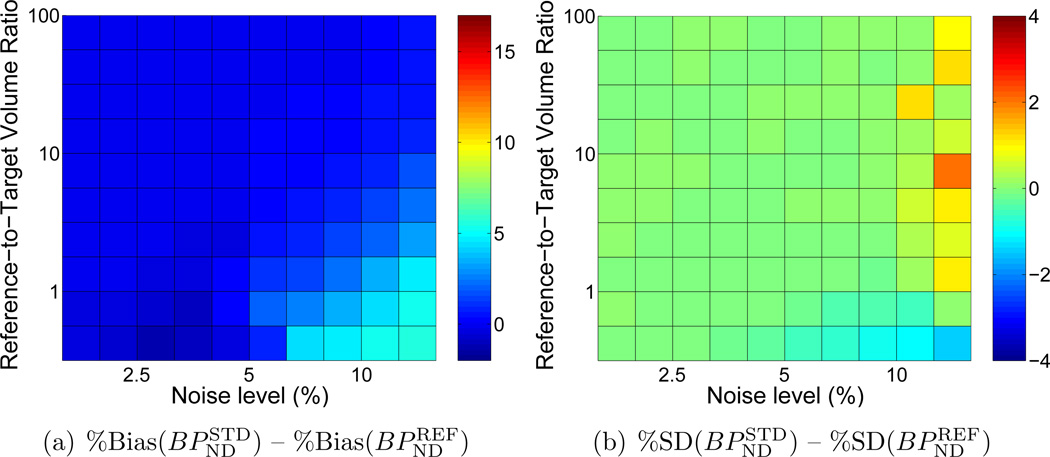
Figure 4.
Comparison of accuracy and precision in BPND estimated by BFM using Standard weighting or Reference weighting with R1 updated iteratively. Difference plots for (a) bias and (b) standard deviation are presented as in Figure 2(e,f), where greater values indicate lower bias and better precision with the Reference weighting method. Comparing (a) and (b) directly to Figure 2(e,f) (note the matching scales) indicates that the performance of Reference with R1 iterated was intermediate between Standard and Reference with R1 fixed. Results with MRTM were similar.

