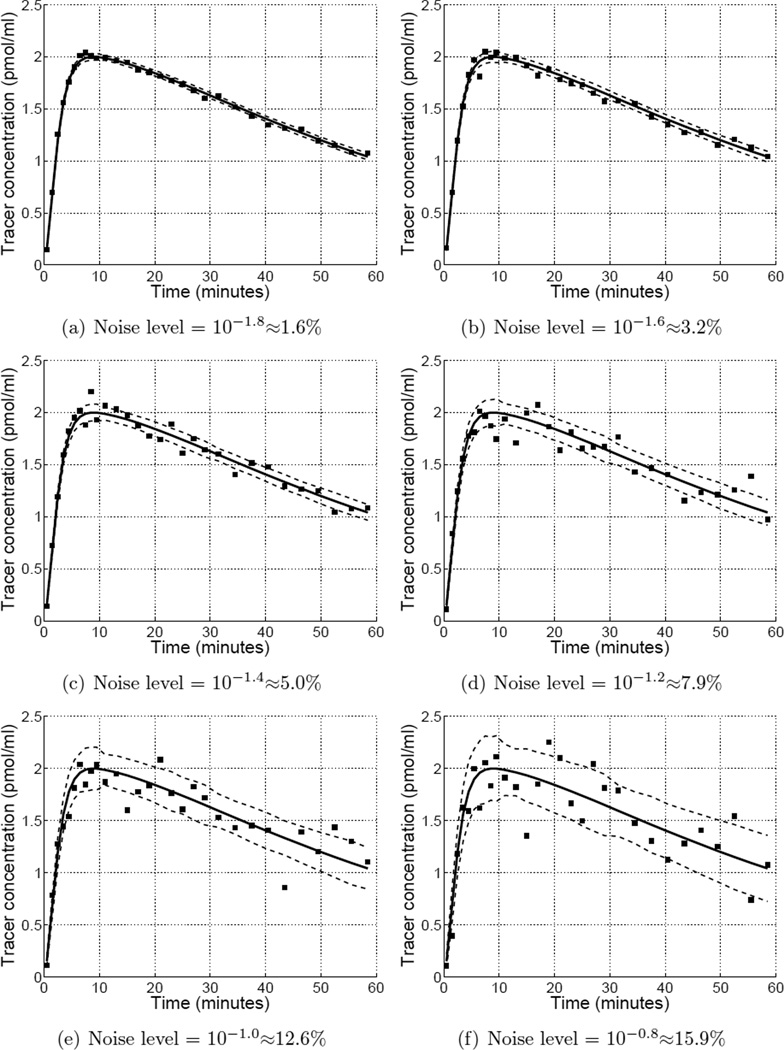
Figure B1.
Simulated time activity curves over a range of noise levels. Markers depict a representative noisy time activity curve. Solid curve shows the noiseless time activity curve. Dashed curves form an envelope of one standard deviation about the mean at each time point across 500 noise replicates.

