Abstract
The diffusion of water into dentin adhesive polymers and leaching of unpolymerized monomer from the adhesive are linked to their mechanical softening and hydrolytic degradation. Therefore, diffusion coefficient data are critical for the mechanical design of these polymeric adhesives. In this study, diffusion coefficients of water and leachables were obtained for sixteen methacrylate-based crosslinked polymers using absorption experiments. The experimental mass change data was interpreted using numerical solution of the two-dimensional diffusion equations. The calculated diffusion coefficients varied from 1.05 × 10⁻⁸ cm2/sec (co-monomer TMTMA) to 3.15 × 10⁻⁸ cm2/sec (co-monomer T4EGDMA). Correlation of the diffusion coefficients with crosslink density and hydrophilicity showed an inverse trend (R2 = 0.41). The correlation of diffusion coefficient with crosslink density and hydrophilicity are closer for molecules differing by simple repeat units (R2 = 0.95). These differences in the trends reveal mechanisms of interaction of the diffusing water with the polymer structure.
Keywords: diffusion, absorption, leachables, crosslink density, finite difference, dentin adhesive
1 Introduction
The lack of effective and durable dentin adhesives is generally considered one of the major problems with the use of composites in direct restorative dentistry. Previous work has shown that the mechanical property of the adhesive not only effects the overall bond or shear strength but has a profound influence on the load transfer mechanism at the dentin-adhesive (a/d) interface and its fatigue life [1–3]. In addition, the change in the mechanical property of the adhesive with time can result in a gradual loss of the mechanical integrity of the a/d interface. The absorption of water by the adhesive polymer and leaching of unpolymerized monomer from the adhesive are linked to mechanical softening and hydrolytic degradation. Diffusion of water coupled with mechanical action can lead to various forms of failure such as brittle destruction or softening without loss of integrity [4, 5]. The viscoelastic properties of the adhesive, in particular, change anomalously with water content under loading [6, 7]. The rate at which these phenomena take place is directly dependent on the diffusion coefficients of water and leachable products in the polymer network of the cured adhesive.
The objective of the present work is to characterize the diffusion coefficients of water and leachable products for “model” methacrylate based dentin adhesives. To this end, absorption experiments were performed on 16 polymer formulations to record their mass change behavior. The experiments for this characterization are performed using deionized water in which the polymer structure interacts with the water molecule alone. These experiments are expected to provide a baseline data for future studies in simulated oral conditions. Diffusion experiments on dentin adhesives using water have also been conducted by other researchers [8–12]. The dentin adhesive resins were prepared using 15 candidate co-monomers along with HEMA (2-hydroxyethyl methacrylate) and BisGMA (Bisphenol A glycerolate (1 glycerol/phenol) dimethacrylate). In the past, similar mass change measurements have been performed to determine the diffusion coefficient of water in polymers and dentin adhesives [8, 13, 14, 9, 15, 16]. In these references, one-dimensional diffusion using Crank’s solution for the fractional solute absorption was applied to disc specimens. In comparison, in the present paper, parallelepiped beam specimens have been utilized, which allows complementary measurements, including mechanical properties, on the same specimen. Since by nature, diffusion depends upon the sample geometry and boundary conditions, Crank’s solution cannot be used to interpret the measurements obtained, and a two-dimensional simulation of the diffusion process is required. The two-dimensional diffusion equations, describing combined water and leachable products diffusion, are solved using a finite difference scheme. The diffusion coefficients were determined using a nonlinear optimization to fit the measured mass change data. The obtained diffusion coefficients were correlated with the polymer crosslink density and hydrophilicity. It was found that crosslink density and hydrophilicity, which are closely related to the co-monomer structure, are the key parameters that control the diffusion phenomena for these polymers.
2 Materials and methods
2.1 Materials
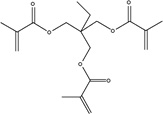
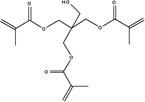
The 16 “model” methacrylate based dentin adhesives were prepared as mixtures of BisGMA (Bisphenol A glycerolate (1 glycerol/phenol) dimethacrylate) and 2-hydroxyethylmethacrylate (HEMA, 99%) along with additional co-monomers. The co-monomers used were ethylene glycol dimethacrylate (EGDMA, 98%), 1,3-butanediol dimethacrylate (1,3-BDMA), 1,4-butanediol dimethacrylate (1,4-BDMA, 98%), bisphenol A ethoxylated dimethacrylate (BisEMA), diethylene glycol dimethacrylate (DEGDMA, 95%), 1,3-glycerol dimethacrylate (GDMA, 85%, mixture of isomers), triethylene glycol dimethacrylate (TEGDMA, 95%), trimethylolpropane trimethacrylate (TMTMA), diurethane dimethacrylate (UDMA, mixture of isomers), tetraethylene glycol dimethacrylate (T4EGDMA), 1,6-hexanediol dimethacrylate (1,6-HDMA), were purchased from Sigma Chemical Co., St. Louis, MO, USA. Co-monomers glyceryl trimethacrylate (GTMA), pentaerythritol trimethacrylate (PETMA) and pentaerythritol dimethacrylate (PEDMA) were purchased from Monomer-Polymer and Dajac Labs, Trevose, PA, USA. Co-monomer neopentyl glycol dimethacrylate (NGDMA) was purchased from Sartomer, Exton, Pennsylvania, USA. The chemical structures of the co-monomers are shown in Table 1. The following three-component visible light photoinitiators (all from Aldrich, Milwaukee, WI) were used in this work: camphoroquinone (CQ, 0.5wt%), ethyl-4-(dimethylamino)benzoate (EDMAB, 0.5wt%) and diphenyliodonium hexafluorophosphaste (DPIHP, 0.5wt%) without further purification. The concentration of the photoinitiator component is calculated with respect to the total amount of monomer. All materials were used as received.
Table 1.
| a. Chemical structures and experimental parameters for the polymerized dentin adhesives in group 1 (the mean values ±the standard deviation of at least three replicates are shown). | ||||
|---|---|---|---|---|
| Group 1 |  |
 |
 |
 |
| Chemical Name | Ethylene glycol dimethacrylate | Diethylene glycol dimethacrylate | Triethylene glycol dimethacrylate | Tetraethylene glycol dimethacrylate |
| Abbreviation | EGDMA | DEGDMA | TEGDMA | T4EGDMA |
| Degree of Conversion (%) | 88.0±0.0 | 92.5 ±0.8 | 92.7±0.6 | 92.5±0.8 |
| Sorption (%) | 7.4±0.17 | 8.59±0.09 | 9.03±0.3 | 12.2±0.98 |
| Solubility (%) | 1.8±0.34 | 0.9±0.21 | 0.6±0.17 | 3.53±0.95 |
| Rubbery Modulus (× 10 MPa) | 108±8.06 | 38.8±3.21 | 35.3±5.77 | 38.5±6.82 |
| Glass transition temperature (°C) | 130.7±7.7 | 152.8±0.7 | 141.1±1.1 | 131.2±2.6 |
| Crosslink Density (molm−3) | 10719.3±205.6 | 3660±319 | 3420±587 | 3820±753 |
| Partition Coefficient | 0.09±0.0022 | 0.107±0.0012 | 0.109±0.0091 | 0.146±0.0 |
| Density (g/cm3) | 1.238±0.01 | 1.242±0.01 | 1.204±0.05 | 1.232±0.01 |
| Leachable Density (× 10−2 g/cm3) | 2.23±0.44 | 1.12±0.27 | 0.72±0.23 | 4.36±1.21 |
| Log P (mol avg.) | 1.295 | 1.243 | 1.203 | 1.175 |
| D of water (× 10−8 cm2/sec) | 1.36 | 1.891 | 2.16 | 3.148 |
| D of leachable (× 10−9 cm2/sec) | 2.184 | 3.162 | 1.733 | 3.526 |
| b. Chemical structures and experimental parameters for the polymerized dentin adhesives in group 2 (the mean values ±the standard deviation of at least three replicates are shown). | |||||
|---|---|---|---|---|---|
| Group 2 |  |
 |
 |
 |
 |
| Chemical Name | 1,6-hexanediol dimethacrylate | Neopentyl glycol dimethacrylate | 1,4-butanediol dimethacrylate | 1,3-butanediol dimethacrylate | Ethylene glycol dimethacrylate |
| Abbreviation | 1,6-HDMA | NGDMA | 1,4-BDMA | 1,3-BDMA | EGDMA |
| Degree of Conversion (%) | 91.5±0.9 | 88.5±3.0 | 91.7±0.4 | 89.6±0.1 | 88.2±0.5 |
| Sorption (%) | 9.25±0.48 | 9.95±0.98 | 6.9±0.15 | 7.2±0.04 | 7.40±0.17 |
| Solubility (%) | 2.66±0.27 | 2.75±0.75 | 0.80±0.26 | 0.9±0.05 | 1.80±0.34 |
| Rubbery Modulus (× 10 MPa) | 56.9±9.9 | 54.9±7.93 | 81.8±5.69 | 154.0±2.57 | 108±8.06 |
| Glass transition temperature (°C) | 150.0±4.8 | 168.3±2.0 | 147.8±4.3 | 153.7±2.6 | 130.7±7.7 |
| Crosslink Density (molm−3) | 5400±111 | 4990±779 | 7790±771 | 18500±1840 | 10800±1440 |
| Partition Coefficient | 0.112±0.00 | 0.107±0.0045 | 0.084±0.0018 | 0.088±0.00 | 0.09±0.0022 |
| Density (g/cm3) | 1.208±0.01 | 1.208±0.02 | 1.221±0.01 | 1.222±0.00 | 1.238±0.01 |
| Leachable Density (× 10−2 g/cm3) | 3.21±0.35 | 3.32±0.97 | 0.98±0.33 | 1.10±0.06 | 2.23±0.44 |
| Log P (mol avg.) | 1.543 | 1.524 | 1.4 | 1.372 | 1.295 |
| D of water (× 10−8 cm2/sec) | 1.721 | 1.497 | 1.358 | 1.406 | 1.36 |
| D of leachable (× 10−9 cm2/sec) | 7.456 | 4.634 | 7.931 | 1.026 | 2.184 |
| c. Chemical structures and experimental parameters for the polymerized dentin adhesives from formulations other than groups 1 and 2 (the mean values ± the standard deviation of at least three replicates are shown). | ||||||||
|---|---|---|---|---|---|---|---|---|
| Other monomers |
 |
 |
 |
 |
 |
 |
||
| Chemical Name |
Pentaerythritol imethacrylate |
Trimethylolpropane trimethacrylate |
Pentaerythritol trimethacrylate |
1,3-glycerol dimethacrylate |
Glyceryl trimethacrylate |
Bisphenol A ethoxylate dimethacrylate |
Diurethane dimethacrylate |
Bisphenol A- glycerolate dimethacrylate |
| Abbreviation | PEDMA | TMTMA | PETMA | GDMA | GTMA | BisEMA | UDMA | BisGMA |
| Degree of Conversion (%) | 88.4±0.9 | 85.9±1.9 | 84.0±1.5 | 89.6±0.4 | 84.2±1.6 | 93.4±0.4 | 92.8±0.3 | 88.0±0.0 |
| Sorption (%) | 9.25±0.09 | 6.93±0.26 | 10.2±0.44 | 9.89±0.53 | 6.74±0.09 | 7.51±0.2 | 7.61±0.2 | 7.5±0.12 |
| Solubility (%) | 2.88±0.45 | 2.00±0.05 | 4.82±0.96 | 1.10±0.27 | 1.00±0.14 | 1.10±0.26 | 0±0.16 | 0.3±0.02 |
| Rubbery Modulus (× 10 MPa) | 55.3±5.68 | 186±25.4 | 122±18.4 | 69.8±9.57 | 38.8±3.21 | 18.9±1.75 | 22.6±2.53 | 24.1±3.14 |
| Glass transition temperature (°C) | 154.7±8.2 | 156±2.6 | 155.2±4.1 | 166.0±1.2 | 164.2±3.3 | 111.1±1.9 | 130.6±0.8 | 142.0±1.8 |
| Crosslink Density (molm−3) | 5190±807 | 17400±266 | 11400±2050 | 6830±923 | 26400±190 | 1980±216 | 2250±264 | 2330±333 |
| Partition Coefficient | 0.102±0.0019 | 0.087±0.0013 | 0.113±0.0115 | 0.124±0.0015 | 0.085±0.0019 | 0.092±0.0028 | 0.092±0.0025 | 0.105±0.0037 |
| Density (g/cm3) | 1.204±0.01 | 1.236±0.01 | 1.227±0.06 | 1.257±0.01 | 1.259±0.01 | 1.224±0.2 | 1.215±0.01 | 1.206±0.02 |
| Leachable Density (× 10−2 g/cm3) | 3.47±0.57 | 2.47±0.07 | 5.91±1.44 | 1.38±0.34 | 1.26±0.19 | 1.35±0.33 | 0.00±0.00 | 0.36±0.02 |
| Log P (mol avg.) | 1.067 | 1.529 | 1.276 | 1.166 | 1.373 | 1.767 | 1.800 | 1.738 |
| D of water (× 10−8 cm2/sec) | 1.532 | 1.060 | 2.542 | 2.382 | 1.172 | 1.563 | 1.334 | 1.882 |
| D of leachable (× 10−9 cm2/sec) | 4.445 | 3.048 | 7.33 | 22.13 | 1.769 | 0.6412 | 2.003 | 0.7882 |
2.2 Methods
2.2.1 Preparation of adhesive resins
Resin mixtures with a mass ratio of 45/30/25 (HEMA/BisGMA/co-monomer) with a 3 component photo-initiator system (0.5 mass percent of camphorquinone (CQ), ethyl-4-dimethylamino benzoate (EDMAB) and diphenyl iodonium phosphate (DPIHP) were prepared in brown vials using each of the co-monomers listed in the Materials section. The resin mixture with a mass ratio of 45/55 (HEMA/BisGMA) and 3 component photo-initiator system was used as a control. The preparation of the adhesive resin mixture using the control has been described previously [17]. The resin mixtures were continuously shaken and sonicated at room temperature for 48 hours until a homogeneous mix was obtained.
2.2.2 Preparation of adhesive polymer beams
Square beams with a side of 1 mm and a length of at least 10 mm were prepared for each co-monomer formulation by casting the prepared adhesive resins into glass-tubing molds (Fiber Optic Center Inc, #CV1012, Vitrocom Round Capillary Tubing of Borosilicate Glass). The adhesive resins were injected into the tubing using a micro-pipette and light polymerized with a LED light curing unit of intensity 250 mW/cm2 and area 6.25 mm2 for 9s (LED Curebox, Prototech, and Portland, OR). The polymerized samples were stored in dark at room temperature for two days to provide adequate time for post-cure polymerization. The samples were subsequently extracted from the glass tubing and stored in a vacuum oven in the presence of a drying agent (freshly dried silica gel) at 37°C.
2.2.3 Degree of Conversion
The degree of conversion (DC) was determined by Raman spectrometer as described previously [18]. In brief, LabRAM ARAMIS Raman spectrometer (LabRAM HORIBA Jobin Yvon, Edison, New Jersey) was used with a HeNe laser (λ=633 nm, a laser power of 17 mW) as an excitation source. The instrument settings were as follows: 200 µm confocal hole, 150 µm wide entrance slit, 600 gr/mm grating, and 10× objective Olympus lens. Data processing was performed using LabSPEC 5 (HORIBA Jobin Yvon). The samples were mounted on a computer-controlled, high-precision x–y stage. To determine the DC, spectra of the unpolymerized resins and rectangular beam samples were acquired over a range of 700 – 1800 cm−1. The changes of the band height ratios of the aliphatic C=C double bond peak at 1640 cm−1 and the aromatic C=C at 1610 cm−1 (phenyl) in both the cured and uncured states were monitored. The DC was calculated as follows, based on the decrease in the intensity band ratios before and after light curing.
| (1) |
where R = band height at 1640 cm−1/band height at 1610 cm−1. All experiments were carried out in triplicate and the results were averaged.
2.2.4 Density Measurements
The densities of the vacuum dried adhesive polymers were measured using an analytical weighing balance with a resolution of 0.01 mg (Mettler Toledo, X205 dual range). The densities were obtained using the mass of the sample in air and in water as follows:
| (2) |
ρ=Density of sample, A=Weight of sample in air, B=Weight of sample in the auxiliary liquid (water), ρ0=Density of the auxiliary liquid (water), and ρL=Air density (0.0012 g/cm3). As can be seen, equation (2) incorporates an adjustment for the buoyancy provided by air.
2.2.5 Dynamic Mechanical Analysis
The measurement of glass transition temperature and apparent rubbery modulus was carried out using dynamic mechanical analysis (DMA Q800, TA Instruments, New Castle, USA) in a 3-point bending configuration. The analysis has been described previously [18]. The frequency used to measure the storage modulus was 1 Hz with amplitude of 15 µm and a pre-load of 0.01 N. The storage modulus was measured across 0°C to 250°C using a temperature sweep. The temperature sweep was conducted at 3°C/min. The glass transition temperature was identified from the peak of the tan δ – temperature curve. The storage modulus decreased with temperature and reached an asymptote at the glass transition temperature. This asymptotic storage modulus was taken to be the apparent rubbery modulus of the polymer. The crosslink density was calculated based on Flory’s rubber elasticity theory [19] as shown below:
| (3) |
where E’ is the apparent rubbery modulus, Tg is the glass transition temperature of the polymer, and the universal gas constant R = 8.31 J K-1mol-1. Equation (3) is based on the kinetic rubber elasticity theory. It is not valid for high degrees of cross linking, but can be used when the storage modulus in the rubbery region is in the range of 2×10⁶ and 2×10⁸ Pa [19]. The storage moduli measured for the polymer formulations in this study were found to lie within this range. Therefore, equation (3) was applied to calculate the crosslink density.
2.2.6 Determination of Log P
The Log P values (ratio of solubility in octanol to solubility in water) for each of the co-monomers and the model adhesives were determined using ChemBioDraw Ultra 12.0 (CambridgeSoft from Perkin Elmer). The Log P value for each model adhesive formulation was determined using the mole fraction-average of individual monomer values as shown below:
| (4) |
Alternatively, the overall LogP could also be calculated based on the mass fractions of each monomer in the formulation.
2.2.7 Absorption Experiment
Multiple beam specimens were used to study the water sorption behavior of each formulation. Distilled, deionized water (HPLC grade, W5SK-4, Fisher Scientific, Fair Lawn, NJ, USA) was used throughout the experiments. The beam specimens were placed into a vacuum chamber for drying until a constant mass m1 was obtained. The specimens were then immersed in water and stored in an incubator (Fischer Scientific – Isotemp incubator) at 37°C. At fixed time intervals (3, 5, 24, 48, 96, 168 and 240th), the specimens were retrieved, blotted dry to remove excess liquid, weighed (m2), and returned to the liquid bath. The values (%) for mass change (Wmc), solubility (Wsu) and water sorption (Wsp) were calculated as follows:
| (5) |
| (6) |
| (7) |
2.2.8 Two-dimensional diffusion model
For the methacrylate based polymers that can be described as low to moderately hydrophilic at low activities, Fick’s law of diffusion and Henry’s law for equilibrium sorption are known to be applicable [20, 21]. Therefore, the diffusion of water into the adhesive polymer beam and the diffusion of unpolymerized monomer into the surrounding water were both modeled using Fick’s law. A similar method has been used by previous researchers to model mass change of methacrylate based polymers in water in a 1-dimensional context [11, 12].
For the water diffusion into the polymer matrix, Fick’s law and the equation of continuity can be written as follows in terms of the local flux (J⃗), the diffusion coefficient (Dw) and the water concentration as mass per unit volume (u):
| (8) |
| (9) |
Equations (8) and (9) can be combined into:
| (10) |
which was solved for the concentrations, u, under specified boundary and initial conditions. Since beam shaped samples with large aspect ratio are used, the end effects can be neglected and the problem can be simplified to be a planar diffusion process in a square domain. A central difference scheme was used to discretize space coordinates and a backward difference scheme was used to discretize time as follows.
| (11) |
| (12) |
Where Δx and Δy are discretized intervals in space and Δt is the discretization in time.
Introducing equations (11) and (12) into equation (1), the discretized equation was obtained as:
| (13) |
| (14) |
| (15) |
Equation (13) was then rearranged by assembling the two dimensional matrices ut and ut +1 into vectors containing the concentrations by moving right to left along the matrix and concatenating all the rows. The matrix form of the equation was obtained as shown in equation (16).
| (16) |
where KDwij are the diffusion multipliers obtained from equation (13). The boundary conditions state that the edges of the square are instantaneously saturated with water whose value is given by Henry’s law constants defined as dimensionless partition coefficients. To this end it is noted that the water sorption reaches a saturation value after 10 days (240 hours) of immersion. The partition coefficient was taken as the ratio of the concentration of water in the polymer at greater than 10 days (saturation) to the concentration of water in pure state.
| (17) |
where cw is the mass per unit volume of pure water and cs is the mass of water per unit volume of polymer when the polymeric matrix is saturated with water. The initial conditions state that the polymer sample interior is free of water at time t=0.
Because free-radical polymerization can vary the density of cross-links in methacrylate-based polymers, the resulting spatial heterogeneity may facilitate the entrapment of residual monomers into the microgels, which will be leached out easily [14]. It can be assumed that the elution was not a long-term process because of the small amount of components and the quick releasing at the early stage. Most of these leachable species are eluted quickly from polymerized resins within a few days [22]. It was assumed that the diffusion coefficients of these hydrophilic leachables are similar and could be treated as integrity for the model so that the difference in overall diffusion of leachables from those crosslinked copolymers can be compared in a straightforward manner. The unreacted hydrophobic components in the polymer diffused in a negligible amount into the aqueous solution during the time of absorbance experiments [23, 24]. Sideridou et al. have also reported [9] that a significant amount of hydrophobic monomer (BisGMA) still remained in the resins even after the second water sorption following a sorption-desorption cycle.
A similar approach as discussed above was used to solve the diffusion equation for the transport of leachable products from the polymer beam into the water. The governing differential equations and their discretized forms for diffusion of leachable products were written in an identical manner to equations (8)–(16), and shown in the Appendix. The diffusion of the leachable products was modeled with an equivalent diffusion coefficient DL, which is a function of the diffusion coefficients and the weight fractions of potential hydrophilic leachables like unreacted monomers, initiator, additives and low molecular weight species [25]. The weights are the mass fractions of these products in the total mass of leachables. The boundary conditions state that the edges of the square leach out the leachables instantaneously and are at a zero concentration of leachable. The initial conditions state that leaching has not started at time t=0 in the polymer matrix interior. The total density of leachable in the polymer at t=0 was taken as the calculated total mass of leached product per unit volume of the polymer after 10 days.
The net mass change at a time, t, and a location, j, was given by the superposition of the mass increase due to the diffusion of water obtained from equation (16) and the mass decrease due to leaching given by equation (28) as shown in equation (18).
| (18) |
The simulated diffusion and net mass change at some time t following immersion in water are illustrated in Figure 1. Thus, the total mass change of the polymer per unit volume was given by the summation of the elemental mass changes over all the elements in the square cross-section.
| (19) |
Figure 1.
Simulated (a) diffusion of water (b) diffusion of leachables and (c) net mass change contours (g/mm3) at time t after immersion in water
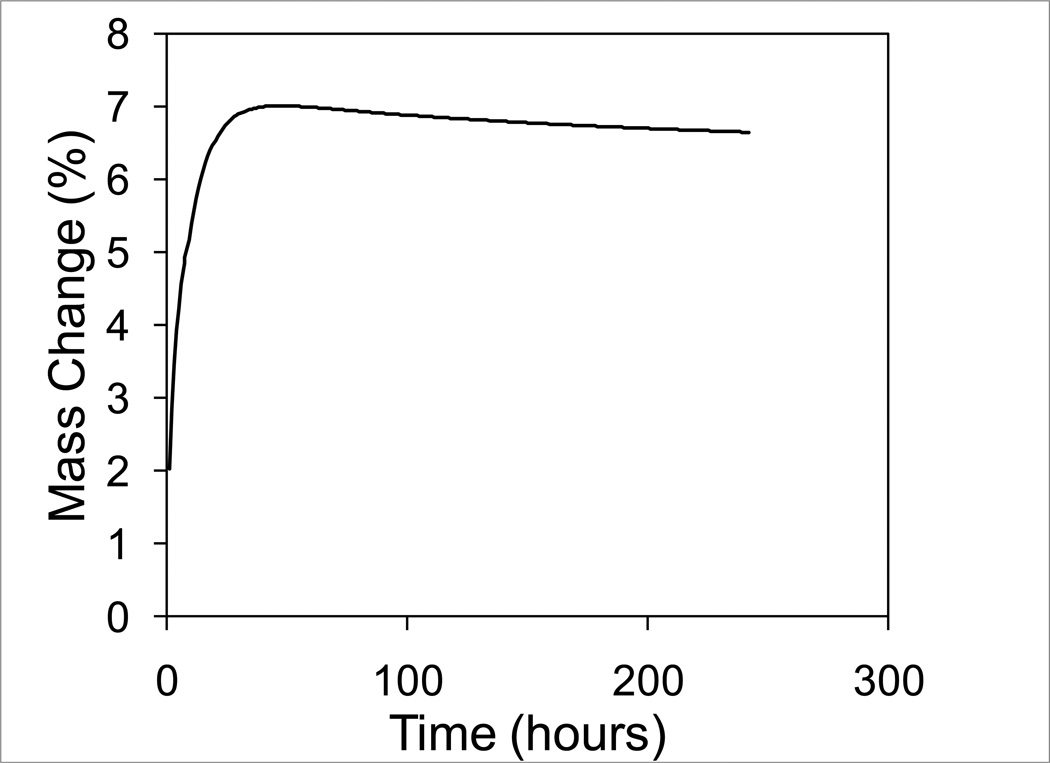
The percentage mass change was given by the total mass change per unit volume scaled by the density of the polymer as depicted in Figure 2. The diffusion coefficients for water and leachables for each polymer formulation were determined by minimizing the sum of squares error between the simulated mass change shown in equation (19) and the experimentally observed mass change described in section 2.2.7. The Nedler-Mead simplex direct search method was used for the optimization.
Figure 2.
Example of net mass change versus time curve for a polymer beam specimen
3 Results
3.1 Degree of Conversion, Density, partition coefficients and Density of Leachables
The chemical structure of methacrylate monomers used in this study has an important role in the behavior of diffusion and partition coefficients. Therefore, a subset of the polymer formulations was collected into 2 groups and the remaining were studied individually. Group 1 consisted of co-monomers with different lengths of ethylene oxide unit between methacrylate groups. Group 2 consisted of co-monomers with different number of aliphatic carbons (branched or straight chain) between the methacrylate groups. Tables 1a, 1b and 1c give the degree of conversion (DC), polymerized adhesive density, partition coefficient of water and density of leachables in polymerized adhesive for group 1, group 2 and the remaining formulations, respectively. The range of variation obtained in the various physical, chemical and mechanical properties indicates that the data is suitable for understanding chemical structure-property trends. Small standard deviation in the measured properties was obtained for each formulation showing the uniformity of sample preparation and experimental methods.
The DC of all the polymerized dentin adhesives was found to be in the narrow range of 83% to 93%. The solubility values ranged from 0 to 4.82%. The solubility was found to be uncorrelated to the degree of conversion. However, a weak trend of decrease in solubility with log P was observed. This trend is consistent with the fact that more hydrophilic formulations are also more likely to leach out. The water sorption of the different formulations varied from 6.74 to 12.21 %. The densities of all the dentin adhesives were close to 1.2 g/cm3. The water sorption values, scaled with the corresponding densities were converted into partition coefficients, as given in equation (17). The log P values were calculated using equation (4) and found to vary from 1.07 to 1.8. The log P values decrease with the hydrophilicity of the co-monomers, as expected. BH+PEDMA with two hydroxyl groups in PEDMA has the lowest log P. It is noteworthy, though, that BH+PEDMA also has a relatively low diffusion coefficient. In group 1, BH+EGDMA has the lowest value of sorption and highest values for rubbery modulus and crosslink density. The sorption values, rubbery modulus and crosslink density respectively decrease, increase and increase with the number of ethylene oxide chains and the hydrophilicity indicated by log P. The glass transition temperature did not show a clear trend. In group 2, the solubility and sorption were seen to decrease with the crosslink density. 1, 6-HDMA, which has an open chain structure, has the lowest crosslink density and the highest values for sorption and solubility. BH+1, 3-BDMA where 1,3-BDMA has a branched chain structure, has the highest rubbery modulus, glass transition temperature and crosslink density. The rubbery modulus is significantly lower for the formulation with its structural isomer, 1, 4-BDMA due to its open chain structure. The solubility is again, observed to be lower for both 1, 3 and 1, 4-BDMA. Among the other formulations, the trimethacrylate monomers are found to increase the crosslink density, as expected. GTMA has the highest crosslink density and correspondingly, the lowest sorption and solubility.
3.2 Absorption experiments and simulation using mathematical model
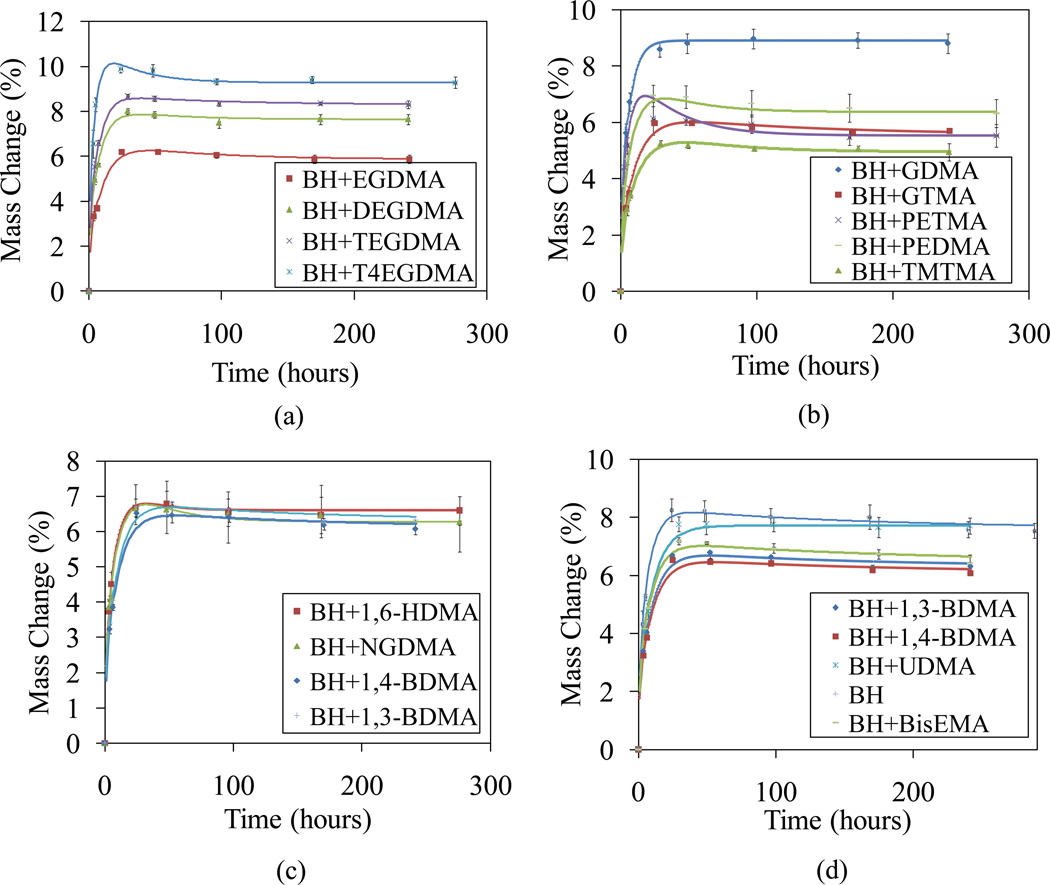
Absorption results for all the model adhesives up to 10 days are shown in Figure 3. The absorption curves are characterized by a peak and a post-peak reduction to a final equilibrium mass change. It can be observed that the measured peak mass change data typically occurred at ~24 hrs and the asymptote was reached at ~100 hrs. The post-peak reduction is attributable to diffusion of leachables, which are expected to have a smaller diffusion coefficient due to their size. Clearly, the water diffusion coefficients would be under-estimated, if they were based on water sorption data alone (i.e., increases in wet mass). Since net increase in wet mass must occur simultaneously with loss of dry mass due to simultaneous solubilization of unreacted monomers, the true water absorption is greater than the measured mass change. The observed peak in the mass change curve was found to be absent in the results for a pre-washed control sample (unpublished data). This shows that the loss of leachables is the only factor contributing to this peak. Similar findings have been reported by other investigators [9].
Figure 3.
Variation of mass changes with time for water sorption sixteen adhesive formulation beam specimens at 37°C (the discrete points show the experimental data and the continuous curves show the fit using the mathematical model)
The fitted percentage mass change curves for the various dentin adhesive polymer formulations are also shown in Figure 3. It can be seen that a good match (R2 ranges from 0.88 to 0.996) is obtained between the simulated and measured mass change for most of the dentin adhesives, which shows that Fickian diffusion is a reasonable assumption for methacrylate based polymers. Table 2 gives the fitted diffusion coefficients of water and leachable products in the polymerized adhesives. The diffusion coefficients of water were found to range from 1.06 to 3.15 ×10⁻⁸ cm2/s. These values are similar to those reported in the literature for other methacrylate based dentin adhesives [9, 8]. The diffusion coefficients of leachables were found to be generally an order of magnitude smaller than the diffusion coefficients of water. However, they exhibited a larger range from 6.41×10⁻¹⁰ to 2.21 ×10⁻⁸ cm2/s.
Table 2.
| a. Parameters from exponential fit for diffusion coefficients | ||||
|---|---|---|---|---|
| A | B | C | R2 | |
| All Formulations | −2.5E-05 | −0.67 | 5.25 × 10⁻⁸ | 0.41 |
| Group 1 | 1.62E-05 | −7.38 | 1.62 × 10⁻⁴ | 0.95 |
| Group 2 | 1.67E-06 | 0.85 | 4.27 × 10⁻⁹ | 0.70 |
| b. Relative contribution of crosslink density and hydrophilicity towards diffusion coefficient | ||||
|---|---|---|---|---|
| Sample | Crosslink Density (mol/m3) |
Log P | Aν | BLog P |
| Group 1 | ||||
| C + EGDMA | 10719.3 | 1.295 | 0.174 | 9.559 |
| C + DEGDMA | 3645.4 | 1.243 | 0.059 | 9.171 |
| C + TEGDMA | 3410.0 | 1.203 | 0.055 | 8.881 |
| C + T4EGDMA | 3807.5 | 1.175 | 0.062 | 8.667 |
| Group 2 | ||||
| C + 1,6- HDMA | 5382.1 | 1.543 | 0.090 | 1.313 |
| C + NGDMA | 4978.3 | 1.524 | 0.083 | 1.297 |
| C + 1,4-BDMA | 7771.5 | 1.400 | 0.130 | 1.192 |
| C + 1,3-BDMA | 5595.8 | 1.372 | 0.093 | 1.168 |
| C + EGDMA | 10719.3 | 1.295 | 0.179 | 1.103 |
4 Discussion
The control dentin adhesives used in this work were a mixture of a modern hydrophobic component (BisGMA) and hydrophilic components (HEMA). The composition was based on conventional dentin adhesives [26, 27]. There is concern that the effects of liquid uptake and hydrolytic degradation may lead to a shortened service life of dental restorations. There is also concern regarding the biological effects elicited by the species evolved from dentin resin restorations, thus requiring the effects of liquid uptake to be investigated [22].
The different model adhesive formulations were tested as candidate dentin adhesives. The coefficients of diffusion for water and for leachables in the polymer network are closely linked to the failure of the adhesive through mechanical softening and hydrolytic degradation. Since the adhesives function at the normal temperature of the human body, the absorption experiments were performed at 37 degrees Celsius. The diffusion coefficients for water transport and leaching have been determined for each of the co-monomer formulations. The diffusion coefficients were correlated to the crosslink density and hydrophilicity of the polymers.
4.1 Factors affecting diffusion and partition coefficients
The factors which can influence the diffusion coefficient of a solvent in crosslinked polymers have been studied by various researchers [28, 19, 29]. It has been reported that the diffusion of a solvent through a crosslinked polymer network is not only due to diffusion through narrow channels. Solvent diffusion also involves restriction of polymer chain motion and interaction of the solvent with the functional groups in the polymer structure [19, 30]. The diffusion takes place because of the difference in chemical potential or difference in Gibbs free energy between the solvent in the polymer and the pure solvent. The Gibbs free energy can be separated into two components – the free energy of mixing and the energy associated with expansion of the polymer network. The free energy of mixing can be represented by the Flory interaction parameter, while the expansion of the network is related to the restriction of polymer chain motion by crosslinks. The formation of hydrogen bonds of the diffusing water with specific sites on the polymer network can also significantly influence the value of the diffusion and partition coefficients [14, 30]. Swelling of the polymer is another factor which can decrease diffusion rate since diffusion in swollen polymers is almost always slower than diffusion in pure solvent [19]. Intra-molecular hydrogen bonds in the polymer may also play a significant role [31]. Previous investigators have explained the diffusion and partition coefficient behavior either by the free-volume theory which accounts for the phenomenon of the solute molecule diffusing through the pore spaces or by the interaction theory which accounts for the interaction of the solute molecule with the chemical structure and the formation of hydrogen bonds at specific sites during the diffusion process [31, 16, 30].
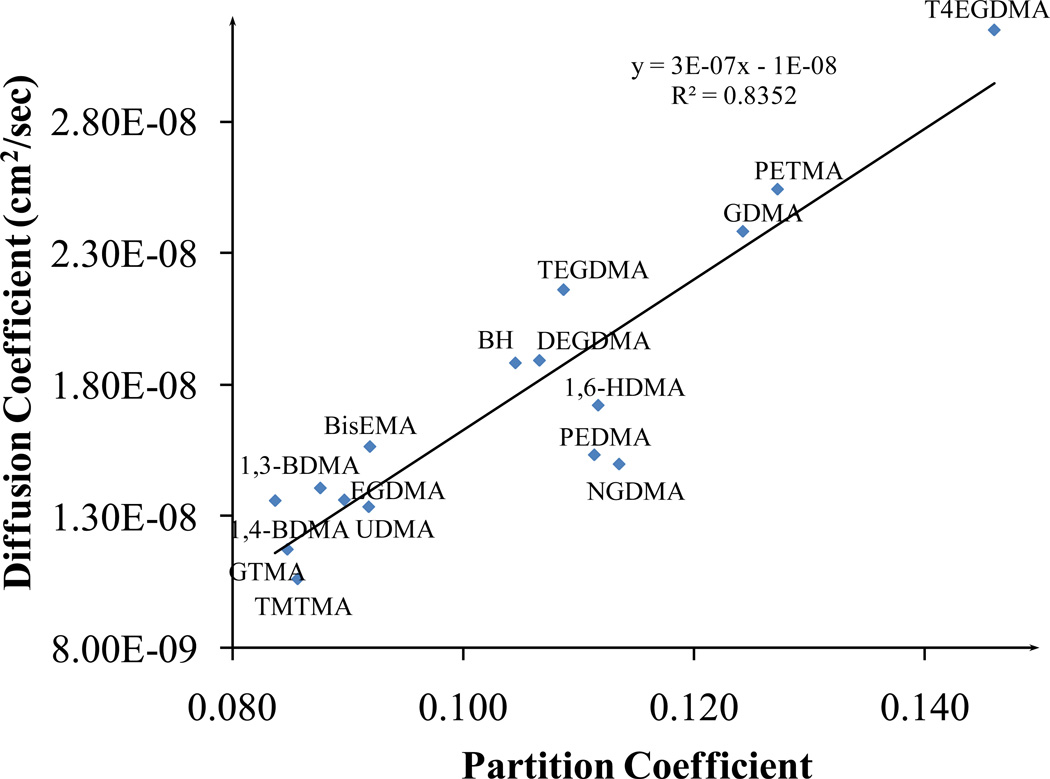
Figure 4 shows the relationship between diffusion coefficient and partition coefficient when all the polymer formulations are considered together. A positive correlation with R2 = 0.83 is found for a linear fit to the data. The positive correlation shows that the contribution of site-specific hydrogen bonds or the influence of water molecules fixing to specific sites during the process of diffusion is minimal on an average [14, 30].
Figure 4.
Correlation between diffusion and partition coefficients for all the sixteen adhesive formulations. The co-monomer name is used to represent the polymeric formulation (BH+co-monomer)
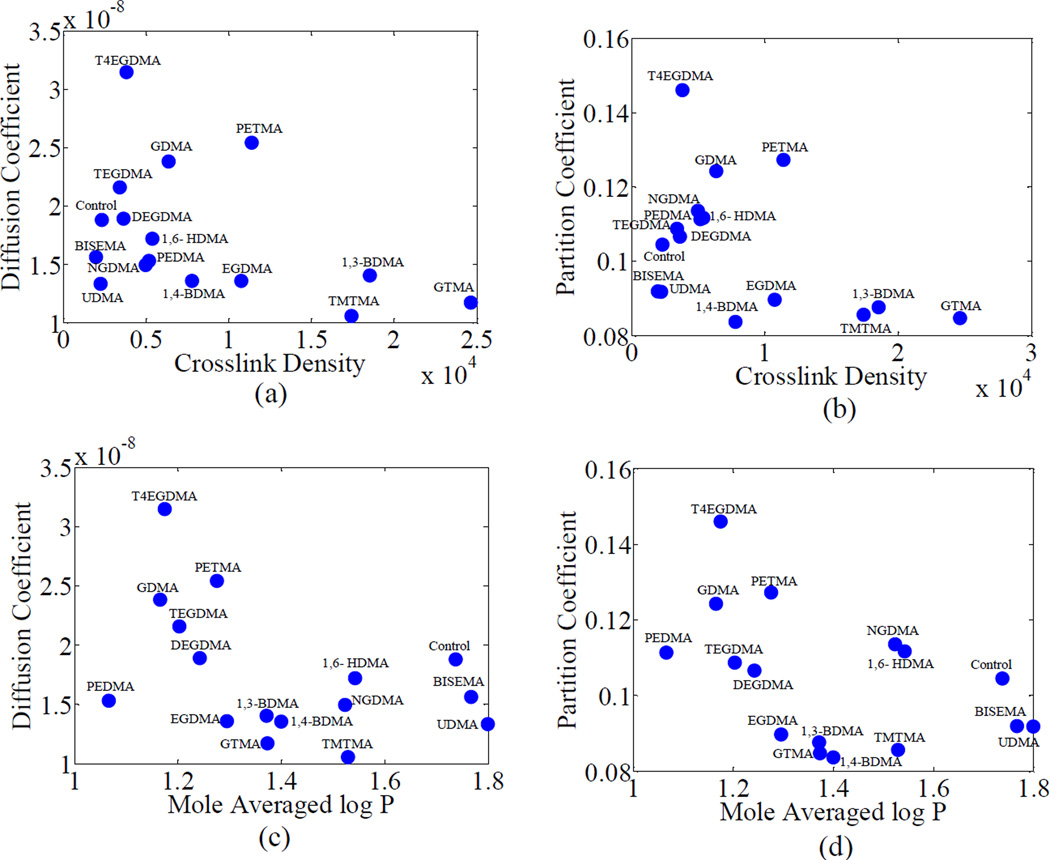
Figure 5 shows the diffusion coefficient and partition coefficient plotted against log P and crosslink density. Both diffusion coefficients and partition coefficients show a decreasing trend with log P and crosslink density. The interaction of the solute with the functional groups in the polymer is represented using mole average log P (hydrophilicity) and the effect and stiffness of polymer network structure is represented by crosslink density, obtained from DMA analysis. The negative correlation of diffusion and partition coefficient with crosslink density is not unexpected since the activation enthalpy associated with the polymer fraction-dependent portion of the swollen network increases with crosslink density [19]. Similarly, the negative correlation between diffusion coefficient, partition coefficient and log P is attributable to an increase in the interaction energy, with hydrophobicity or log P. Based on Krongauz et al. [19], the diffusion coefficients of small molecules in crosslinked polymers have an exponential dependence on the polymer-solvent interaction energy as well as the free energy of polymer chain extension. Therefore, the variation in diffusion coefficients can be modeled using an exponential dependence on the hydrophilicity as well as the crosslink density as shown in equation (20).
| (20) |
where ν = crosslink density, and A, B and C = fitting constants. Table 2a gives the fitting constants and the goodness of fit parameter R2 for the entire set of polymers, group 1 and group 2 polymers, respectively. The relative contributions of crosslink density and log P to the diffusion coefficient can be observed from the values of the products Aν and BLog P given in Table 2b. The inverse trend of diffusion coefficient with crosslink density and Log P can be observed from the negative values of A and B when the fit is made for the entire dataset and confirms the trends observed in Figure 5. Since the data involves co-monomer molecules that have different structures and functional groups there is considerable scatter in the data as shown by the low R2 (= 0.41).
Figure 5.
Variation of diffusion and partition coefficients with crosslink density and mole averaged log P for the sixteen adhesive formulations. The co-monomer name is used to represent the polymeric formulation (BH+co-monomer)
4.2 Effect of co-monomer structure
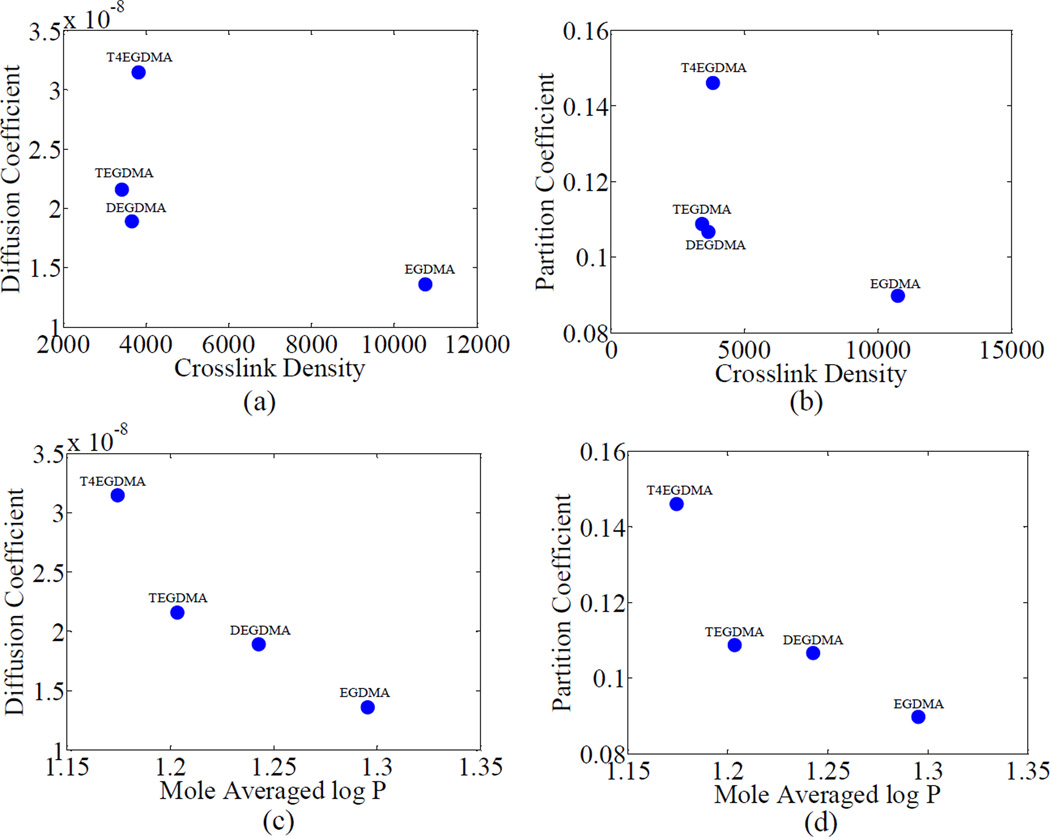
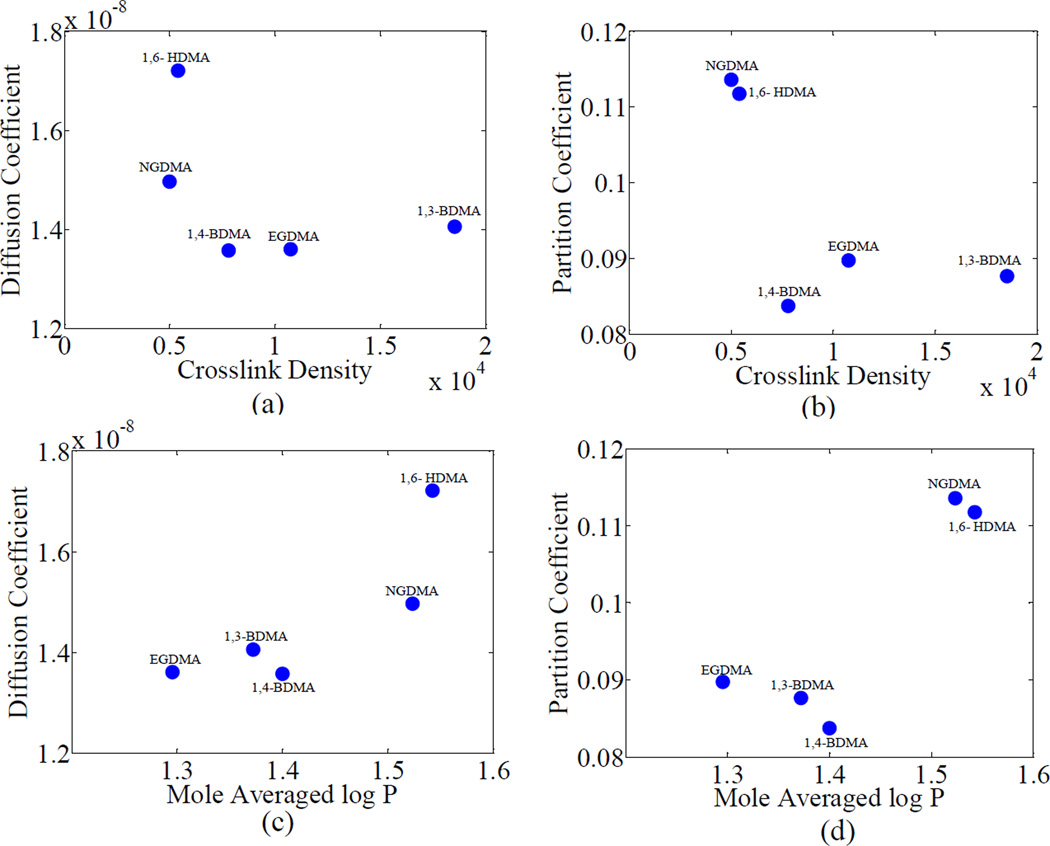
The relationships of diffusion and partition coefficient with crosslink density and LogP are shown in Figures 6 and 7 for groups 1 and 2, respectively. In group 1, the diffusion and the partition coefficients, were both seen to decrease with logP value, which is inversely proportional to hydrophilicity as shown in Figures 6(c) and (d). This effect can be explained based on the fact that increasing hydrophilicity aids in decreasing the activation energy required for diffusion by helping the water molecules to overcome the attractive forces between themselves. Similar relationships were also observed by Yiu et al. and Malacarne et al. [14, 30]. On the other hand the diffusion and the partition coefficients, were not observed to show any specific trend with crosslink density. The crosslink density values of BH+DEGDMA, BH+TEGDMA and BH+T4EGDMA were not significantly different (p=0.285) from each other. Therefore, the observed difference in diffusion (and partition) coefficients may be mainly attributed to the differences in hydrophobicity (log P). BH+EGDMA has a much higher crosslink density than the other three formulations in the group. However, the diffusion and partition coefficients of BH+EGDMA were still observed to follow the same trend as the other three in their dependence on log P. This also shows that the effect of crosslink density on diffusion and partition coefficients is minimal for this group and the majority of the dependence is on the hydrophobicity. A comparison of the values of BLog P and Aν in group 1, shown in Table 2b, further confirms that the majority of the variance in data in this group can be explained using hydrophilicity. Also, since the partition and diffusion coefficients show similar trends for this group, these results may be interpreted to suggest that the formation of site specific hydrogen bonds is minimal [14, 30].
Figure 6.
Variation of diffusion and partition coefficients of water with crosslink density and log P for group 1. The co-monomer name is used to represent the polymeric formulation (BH+co-monomer)
Figure 7.
Variation of diffusion and partition coefficients of water with crosslink density and log P for group 2. The co-monomer name is used to represent the polymeric formulation (BH+co-monomer)
From the values of BLog P and Aν for group 2, shown in Table 2b, it is observed that similar to group 1, the hydrophilicity has a stronger influence on the diffusion behavior as compared to the crosslink density. However, the percentage of variance in the diffusion coefficients, as shown by the R2 values in Table 2a, explained by the crosslink density and hydrophilicity is less than group 1. This is expected since the co-monomer chemical structures in group 1 differ by a simple repeating unit of ethylene oxide, while those in group 2 differ in a more complex way. A major difference in group 2 is that the diffusion coefficient shows a positive correlation with Log P, or a negative correlation with hydrophilicity. This phenomenon may be due to various confounding factors discussed subsequently.
It is seen from Figures 7(a) and 7(b) that the diffusion coefficient and partition coefficient decrease with the crosslink density. However, noting that the contributions of crosslink density in comparison to hydrophilicity for this group is minimal, as shown in Table 2b, this decrease should be considered not causal. The diffusion coefficients of BH+1,3-BDMA, BH+1,4-BDMA and BH+EGDMA are similar while that of BH+1,6-HDMA is substantially different from these three and from BH+NGDMA. The variation of the partition coefficients with hydrophilicity is not straightforward. From Figures 7(a) and 7(b) it can be seen that BH+NGDMA has a much lower diffusion coefficient than BH+1,6-HDMA though they are close in terms of both crosslink density and hydrophilicity. The lower diffusion coefficient is likely due to the branched chain structure of BH+NGDMA as compared to the straight chain structure of BH+1,6-HDMA. Thus, in some cases, the packing density, or free volume, which is dependent upon the chemical structure, might also play an important role in determining the diffusive behavior of water. In this case, there could be a more complex interplay of the diffusing water with these polymeric structures, possibly involving hydrogen bonding. Other comparisons can also be made based upon similarity of chemical structures from Table 1c. For instance, the co-monomer molecules of BH+GDMA and BH+PEDMA have similar chemical structures. However, the former resin molecule contains two hydroxyl groups in comparison to one hydroxyl group in BH+GDMA. In similarity to group 2, the diffusion coefficient and partition coefficient of BH+PEDMA is much lower than that of BH+GDMA. In this case, the formation of internal polymer-water hydrogen bonds within the polymer network which could restrict the movement as well as accumulation of water through the polymer network can play a significant role. This is the likely reason why PEDMA appears as an outlier on the overall plots of diffusion and partition coefficients versus log P. The formulations BH, BH+BisEMA and BH+UDMA showed a similar trend as observed by others [11].
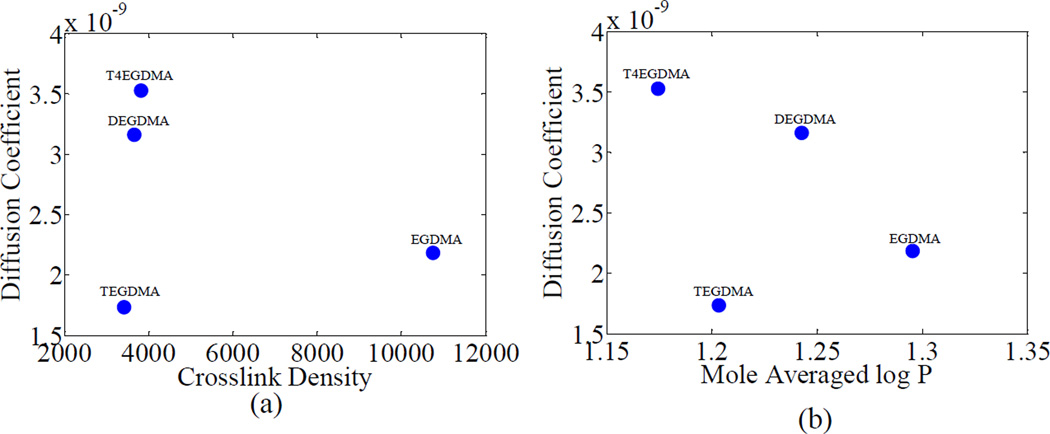
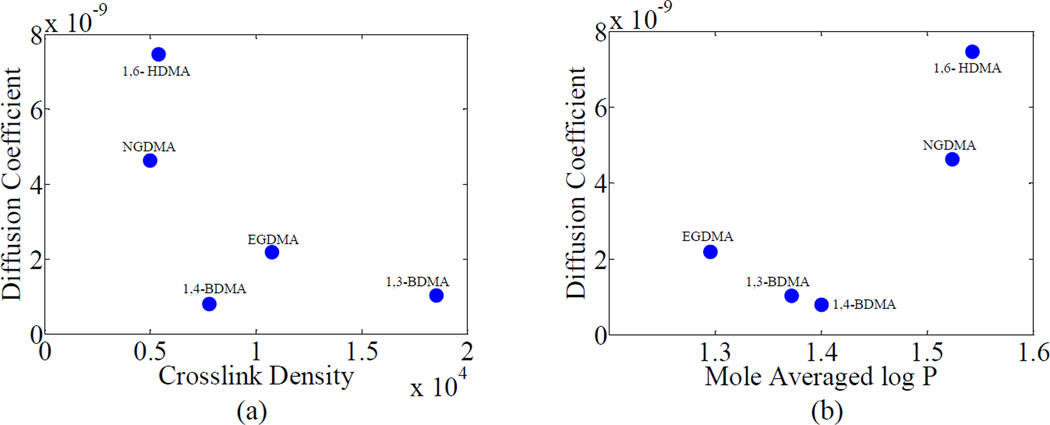
The diffusion coefficients of the leachables of the polymers are seen to follow similar trends as the diffusion coefficients of water in the polymer. For comparison the diffusion coefficients of the leachables for groups 1 and 2 are shown in Figures 8 and 9. The diffusion coefficients for the leachables are seen to be an order of magnitude less than the diffusion coefficients for water. It has been observed that the diffusivity of a solute through a crosslinked polymer structure decreases exponentially with solute size, as recently observed by Zustiak et al. [32]. The leached products probably consist of unpolymerized monomer and filler material, which are large molecules compared to water. Also, the similarity in the trends of the diffusion coefficient of water as well as diffusion coefficient of leachables supports the assumption that negligible amounts of unreacted hydrophobic components in the polymer diffused into the aqueous solution during the time of the absorbance experiments. The difference in order of magnitude may be attributed to the size of the effusing molecules.
Figure 8.
Variation of diffusion coeffecients of leachables with crosslink density and log P for group 1. The co-monomer name is used to represent the polymeric formulation (BH+co-monomer)
Figure 9.
Variation of diffusion coeffecients of leachables with crosslink density and log P for group 2. The co-monomer name is used to represent the polymeric formulation (BH+co-monomer)
5 Conclusions
The agreement between the measured and fitted mass change data of the polymer formulations shown in Figure 3 indicate that the diffusion of water as well as leachables within the polymer network is predominantly Fickian in nature. Based on the observed trends, the diffusion coefficients, crosslink density and hydrophilicity were found to be suitable predictors of diffusion in methacrylate based crosslinked polymers. A study of the exponential fit between the diffusion coefficients and the predictors revealed their relative influence on the diffusion coefficients. In general, the hydrophilicity is found to have a greater influence on the diffusion behavior of water in methacrylate based dentin adhesive polymers investigated in this paper. The approximately linear positive correlation brought out between diffusion and partition coefficients indicates that the formation of hydrogen bonds of the solute with the polymeric structure during diffusion is minimal. The results suggest that the diffusion behavior of water and leachable molecules can be related to the comonomer chemical structure.
There is ongoing research in our group towards the identification of suitable dentin adhesives for composite restorations. It has been shown that the phenomenon of anomalous or accelerated creep occurs only when there is diffusion of the solvent into the polymer matrix and not when the sample is in a dry or fully saturated state [7]. Further, the extent of anomalous creep is directly influenced by the rate of sorption of solvent into the polymer matrix [33]. To this end, the diffusion coefficients calculated in this paper will aid in the mechanical design of the adhesive based composite restoration under dynamic loading. The trends developed for the variation of the diffusion coefficient with crosslink density and hydrophilicity will assist in development of structure-property relationships and identification of candidate monomers for development of these dentin adhesives.
Table 3.
Fitted diffusion coefficients of the polymerized dentin adhesives
| Diffusion coefficient of water (cm2/sec) |
Diffusion coefficient of leachable (cm2/sec) |
|
|---|---|---|
| BH-Control | 1.881E-08 | 7.831E-09 |
| T4EGDMA | 3.150E-08 | 3.530E-09 |
| NGDMA | 1.496E-08 | 4.634E-09 |
| PETMA | 2.542E-08 | 7.330E-09 |
| PEDMA | 1.531E-08 | 4.445E-09 |
| 1,6-HDMA | 1.721E-08 | 7.467E-09 |
| EGDMA | 1.360E-08 | 2.184E-09 |
| DEGDMA | 1.891E-08 | 3.161E-09 |
| TEGDMA | 2.160E-08 | 1.733E-09 |
| GDMA | 2.382E-08 | 2.212E-08 |
| GTMA | 1.172E-08 | 1.769E-09 |
| 1,3-BDMA | 1.406E-08 | 1.026E-09 |
| 1,4-BDMA | 1.358E-08 | 7.931E-10 |
| BisEMA | 1.563E-08 | 6.412E-10 |
| TMTMA | 1.060E-08 | 3.048E-09 |
| UDMA | 1.334E-08 | 2.003E-09 |
ACKNOWLEDGEMENTS
This investigation was supported by Research Grants: R01DE14392 (PI: Spencer) and 3R01DE14392-08S109 (PI: Spencer) from the National Institute of Dental and Craniofacial Research, National Institutes of Health, Bethesda, MD 20892.
Appendix
The diffusion of leachables is explained in a similar way to water diffusion. The governing equations for leaching are given in terms of the local flux (J⃗), the diffusion coefficient (E) and the concentration of leachable (v) as follows:
| (21) |
| (22) |
| (23) |
| (24) |
| (25) |
| (26) |
| (27) |
Assembling the system of discretized equations gives the form shown below.
| (28) |
KDLij are the diffusion (leachable) multipliers obtained from equation (25).
References
- 1.Misra A, Spencer P, Marangos O, Wang Y, Katz JL. Micromechanical analysis of dentin/adhesive interface by the finite element method. Journal of Biomedical Materials Research Part B: Applied Biomaterials. 2004;70(1):56–65. doi: 10.1002/jbm.b.30012. [DOI] [PMC free article] [PubMed] [Google Scholar]
- 2.Misra A, Spencer P, Marangos O, Wang Y, Katz JL. Parametric study of the effect of phase anisotropy on the micromechanical behaviour of dentin–adhesive interfaces. Journal of The Royal Society Interface. 2005;2(3):145. doi: 10.1098/rsif.2005.0029. [DOI] [PMC free article] [PubMed] [Google Scholar]
- 3.Singh V, Misra A, Marangos O, Park J, Qiang Y, Kieweg S, et al. Fatigue life prediction of dentin-adhesive interface using micromechanical stress analysis. Journal of Dental Materials. 2011 doi: 10.1016/j.dental.2011.05.010. Accepted, In print. [DOI] [PMC free article] [PubMed] [Google Scholar]
- 4.Rudakova TE, Zaikov GE. Stressed polymers in physically active media. Polymer degradation and stability. 1988;21(2):105–120. [Google Scholar]
- 5.Rudakova TY, Zaikov GY. Effect of an aggressive medium and mechanical stress on polymers. Review. Polymer Science USSR. 1987;29(1):1–19. [Google Scholar]
- 6.Misra A, Singh V, Parthasarathy R, Marangos O, Spencer P. Mathematical model for anomalous creep in model dentin adhesives. Journal of Dental Research. 2011;90A(0574) [Google Scholar]
- 7.Singh V, Misra A, Marangos O, Park J, Ye Q, Kieweg S, et al. Anomalous creep in model dentin adhesive under changing moisture conditions. Journal of Dental Research. 2011;90A(1708) [Google Scholar]
- 8.Costella AM, Trochmann JL, Oliveira WS. Water sorption and diffusion coefficient through an experimental dental resin. Journal of Materials Science: Materials in Medicine. 2010;21(1):67–72. doi: 10.1007/s10856-009-3847-5. [DOI] [PubMed] [Google Scholar]
- 9.Sideridou ID, Karabela MM. Characteristics of the sorption of water and an ethanol/water solution by light cured copolymers of 2 hydroxyethyl methacrylate with dental dimethacrylates. Journal of Applied Polymer Science. 2008;109(4):2503–2512. [Google Scholar]
- 10.Sideridou ID, Karabela MM. Sorption of water, ethanol or ethanol/water solutions by light-cured dental dimethacrylate resins. Dental Materials. 2011;27(10):1003–1010. doi: 10.1016/j.dental.2011.06.007. [DOI] [PubMed] [Google Scholar]
- 11.Sideridou ID, Karabela MM, Vouvoudi EC, Papanastasiou GE. Sorption and desorption parameters of water or ethanol in light cured dental dimethacrylate resins. Journal of Applied Polymer Science. 2008;107(1):463–475. [Google Scholar]
- 12.Sideridou ID, Papanastasiou GE. Water sorption kinetics in light cured poly HEMA and poly (HEMA co TEGDMA); determination of the self diffusion coefficient by new iterative methods. Journal of Applied Polymer Science. 2007;106(4):2380–2390. [Google Scholar]
- 13.Hill DJT, Whittaker AK. Water diffusion into radiation crosslinked PVA-PVP network hydrogels. Radiation Physics and Chemistry. 2011 [Google Scholar]
- 14.Malacarne J, Carvalho RM, de Goes MF, Svizero N, Pashley DH, Tay FR, et al. Water sorption/solubility of dental adhesive resins. Dental Materials. 2006;22(10):973–980. doi: 10.1016/j.dental.2005.11.020. [DOI] [PubMed] [Google Scholar]
- 15.Tham WL, Chow WS, Ishak ZAM. Simulated body fluid and water absorption effects on poly (methyl methacrylate)/hydroxyapatite denture base composites. Express Polymer Letters. 2010;4(9):517–528. [Google Scholar]
- 16.Unemori M, Matsuya Y, Matsuya S, Akashi A, Akamine A. Water absorption of poly (methyl methacrylate) containing 4-methacryloxyethyl trimellitic anhydride. Biomaterials. 2003;24(8):1381–1387. doi: 10.1016/s0142-9612(02)00521-5. [DOI] [PubMed] [Google Scholar]
- 17.Singh V, Misra A, Marangos O, Park J, Ye Q, Kieweg SL, et al. Viscoelastic and fatigue properties of model methacrylate based dentin adhesives. Journal of Biomedical Materials Research Part B: Applied Biomaterials. 2010;95(2):283–290. doi: 10.1002/jbm.b.31712. [DOI] [PMC free article] [PubMed] [Google Scholar]
- 18.Park JG, Ye Q, Topp EM, Lee CH, Kostoryz EL, Misra A, et al. Dynamic mechanical analysis and esterase degradation of dentin adhesives containing a branched methacrylate. Journal of Biomedical Materials Research Part B: Applied Biomaterials. 2009;91(1):61–70. doi: 10.1002/jbm.b.31374. [DOI] [PMC free article] [PubMed] [Google Scholar]
- 19.Krongauz VV. Diffusion in polymers dependence on crosslink density. Journal of thermal analysis and calorimetry. 2010;102(2):435–445. [Google Scholar]
- 20.Ghi PY, Hill DJT, Maillet D, Whittaker AK. Nmr imaging of the diffusion of water into poly (tetrahydrofurfuryl methacrylate-co-hydroxyethyl methacrylate) Polymer. 1997;38(15):3985–3989. [Google Scholar]
- 21.Thominette F, Gaudichet-Maurin E, Verdu J. Effect of structure on water diffusion in hydrophilic polymers. Defect and Diffusion Forum. 2007;258–260:442–446. [Google Scholar]
- 22.Ferracane JL. Hygroscopic and hydrolytic effects in dental polymer networks. Dental Materials. 2006;22(3):211–222. doi: 10.1016/j.dental.2005.05.005. [DOI] [PubMed] [Google Scholar]
- 23.Ye Q, Park JG, Topp E, Wang Y, Misra A, Spencer P. In vitro performance of nano-heterogeneous dentin adhesive. Journal of dental research. 2008;87(9):829. doi: 10.1177/154405910808700911. [DOI] [PMC free article] [PubMed] [Google Scholar]
- 24.Ye Q, Park J, Pamatmat F, Misra A, Parthasarathy R, Marangos O, et al. Quantitative analysis of aqueous phase composition of model dentin adhesives experiencing phase separation. Acta Biomaterialia. 2011 doi: 10.1002/jbm.b.32675. Under Review. [DOI] [PMC free article] [PubMed] [Google Scholar]
- 25.Kostoryz EL, Dharmala K, Ye Q, Wang Y, Huber J, Park JG, et al. Enzymatic biodegradation of HEMA/bisGMA adhesives formulated with different water content. Journal of Biomedical Materials Research Part B: Applied Biomaterials. 2009;88(2):394–401. doi: 10.1002/jbm.b.31095. [DOI] [PMC free article] [PubMed] [Google Scholar]
- 26.Pashley EL, Zhang Y. Effects of HEMA on water evaporation from water-HEMA mixtures. Dental Materials. 1998;14(1):6–10. doi: 10.1016/s0109-5641(98)00003-7. [DOI] [PubMed] [Google Scholar]
- 27.Spencer P, Wang Y. Adhesive phase separation at the dentin interface under wet bonding conditions. Journal of biomedical materials research. 2002;62(3):447–456. doi: 10.1002/jbm.10364. [DOI] [PubMed] [Google Scholar]
- 28.Amsden B. Solute diffusion within hydrogels. Mechanisms and models. Macromolecules. 1998;31(23):8382–8395. [Google Scholar]
- 29.Wu Y, Joseph S, Aluru NR. Effect of cross-linking on the diffusion of water, ions, and small molecules in hydrogels. The Journal of Physical Chemistry B. 2009;113(11):3512–3520. doi: 10.1021/jp808145x. [DOI] [PubMed] [Google Scholar]
- 30.Yiu CKY, King NM, Carrilho MRO, Sauro S, Rueggeberg FA, Prati C, et al. Effect of resin hydrophilicity and temperature on water sorption of dental adhesive resins. Biomaterials. 2006;27(9):1695–1703. doi: 10.1016/j.biomaterials.2005.09.037. [DOI] [PubMed] [Google Scholar]
- 31.Bellenger V, Verdu J, Morel E. Structure-properties relationships for densely cross-linked epoxide-amine systems based on epoxide or amine mixtures. Journal of materials science. 1989;24(1):63–68. [Google Scholar]
- 32.Zustiak SP, Leach JB. Characterization of protein release from hydrolytically degradable poly (ethylene glycol) hydrogels. Biotechnology and bioengineering. 2011 doi: 10.1002/bit.22911. [DOI] [PMC free article] [PubMed] [Google Scholar]
- 33.Habeger CC, Coffin DW, Hojjatie B. Influence of humidity cycling parameters on the moisture accelerated creep of polymeric fibers. Journal of Polymer Science Part B: Polymer Physics. 2001;39(17):2048–2062. [Google Scholar]


