Figure 2.

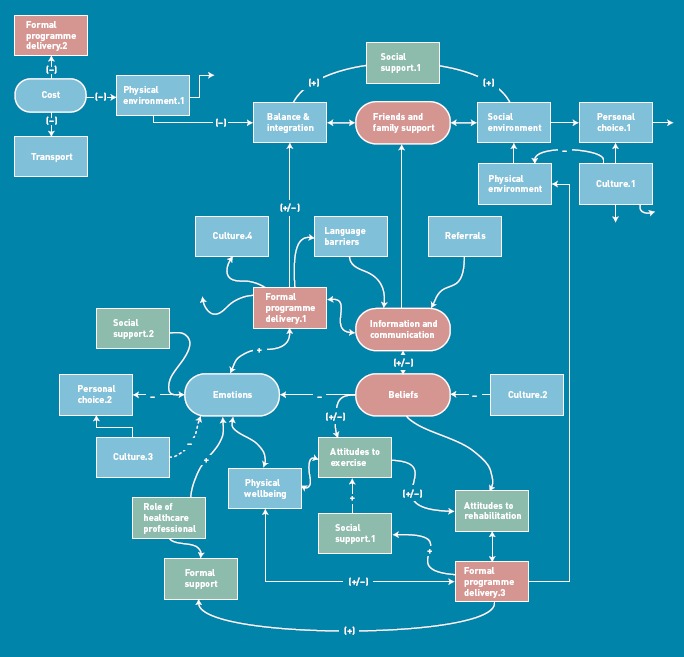
Potential clusters of categories arising from analysis of overlapping factors. Green boxes: categories with <40% barrier type factors. Blue boxes: categories with between 40–59% barriers. Red boxes: categories with ≥60% barriers.

Potential clusters of categories arising from analysis of overlapping factors. Green boxes: categories with <40% barrier type factors. Blue boxes: categories with between 40–59% barriers. Red boxes: categories with ≥60% barriers.