Figure 2.

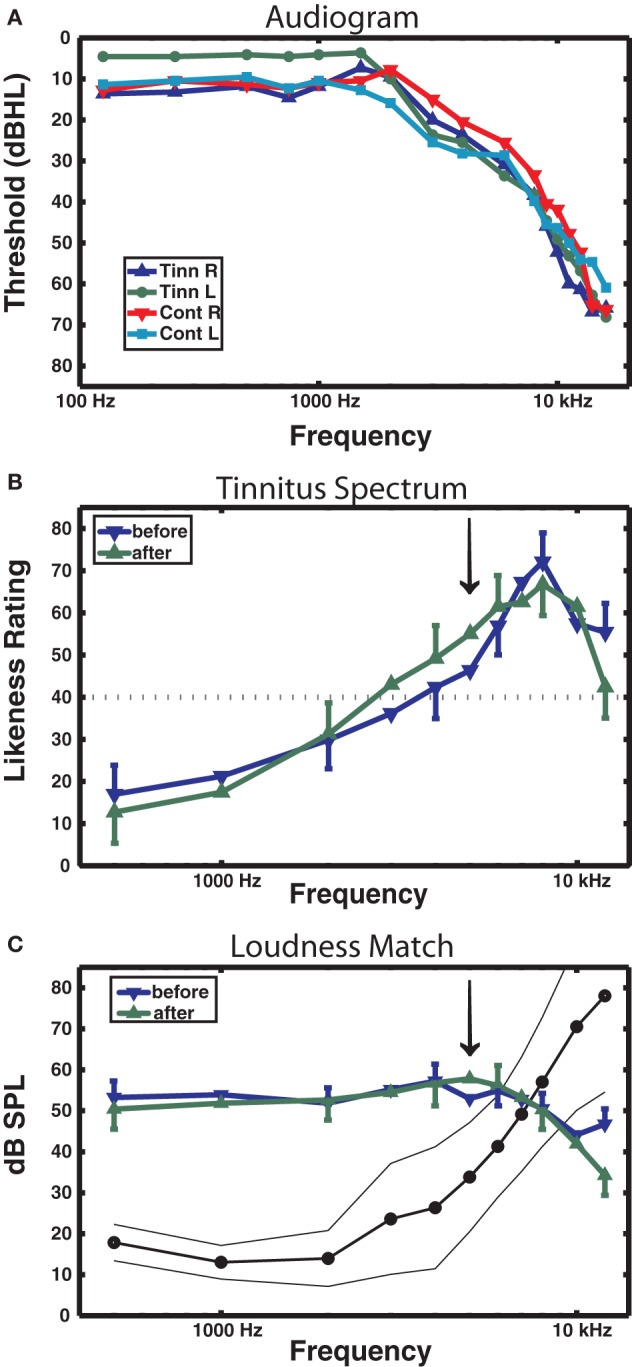
Audiometric and psychoacoustic measures. (A) Audiogram for each group, right and left ears shown separately. For clarity, error bars are omitted (group main effect F < 1). (B) Tinnitus spectrum (likeness ratings) before and after training in the tinnitus group, from the Tinnitus Tester software (Roberts et al., 2008). A likeness rating of 40 (broken line) corresponds to sounds beginning to resemble the individual's tinnitus (the lower boundary of the tinnitus spectrum; Roberts et al. (2008). The arrow denotes the 5 kHz training frequency. (C) Loudness matches from the Tinnitus Tester, before and after training. The line connected by dots denotes the group averaged audiogram converted from dB HL to dB SPL (thin lines denote between-subject 95% confidence limits). The difference between the audiogram and the loudness matches gives an approximate estimate of the loudness of the tinnitus in dB SL (Roberts et al., 2008). Error bars shown in panels (B) and (C) are the mean within-subject standard error (1 SE).
