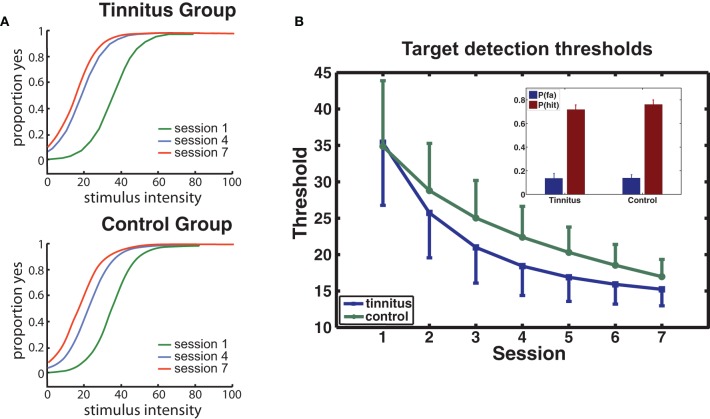
Figure 3.
Behavioral performance. (A) Group averaged psychophysical functions are shown for sessions 1, 4, and 7, separately for each group. (B) Changes in target detection THs over sessions for each group. The model used for curve fitting of each participant's data applied a negative exponential (direction determined by the data; see Materials and Methods). Error bars give the mean within-subject standard error (1 SE). The inset shows the mean hit and false alarm rates for each group.

